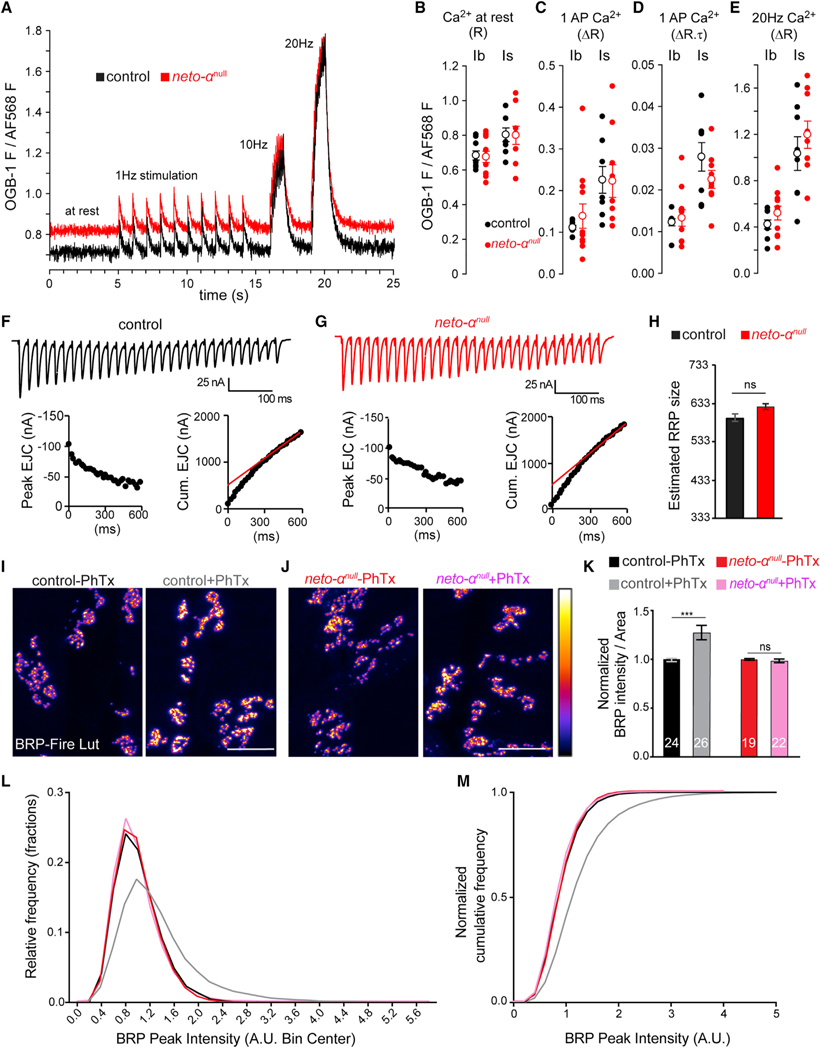
Figure 6. Neto-αnull MN Terminals Reveal No Ca2+ Entry Deficit, but Cytomatrix Remodeling Is Impaired.
(A–E) AP-mediated Ca2+ transients are no different in neto-αnull MN terminals relative to control. (A) Single-trial traces of changes in Ca2+-sensitive Oregon green BAPTA-1 (OGB-1) fluorescence relative to Ca2+-insensitive Alexa Fluor 568 (AF568) fluorescence in the cytosol of type Ib terminals on muscle 6 in response to stimuli applied to the hemisegment nerve: 10 at 1 Hz, 10 at 10 Hz, and 20 at 20 Hz. OGB-1 images were collected at 112 frames per second. (B) Scatterplot of OGB-1/AF568 fluorescence before nerve stimulation, representing [Ca2+]c at rest. Each closed circle represents a ratio (R) measurement from a specific terminal type (Ib or Is) in a different larva. Open circles represent mean ± SEM. (C) Scatterplot of the amplitude (change in ratio [ΔR]) of Ca2+ transients evoked by stimuli delivered at 1 Hz. (D) Scatterplot of the product of amplitude (ΔR) and decay time course (t; reported in seconds) of Ca2+ transients evoked by 1 Hz stimuli (ΔR.t).
(E) Scatterplot of the amplitude (DR) of Ca2+ transients evoked by a 10 Hz train of stimuli. All data were collected from muscle 6, segment A4, in 0.5 mM Ca2+ HL-3. The p values from Student’s t tests are reported in the text. The Mann-Whitney U test was applied when normality tests failed.
(F and G) Representative EJC traces (top) and cumulative peak EJC amplitudes (bottom) for 30 stimuli at 50 Hz at 1.5 mM Ca2+ in control (F) and neto-αnull (G).
(H) Estimated RRP sizes for control and neto-αnul are similar (n = 5, p = 0.1441).
(I–K) Quantification of BRP intensity following 10 min of vehicle or PhTx treatment at control and neto-αnull NMJs. BRP is showed in Fire-lut; on the intensity scale, white represents peak intensity (20,000 arbitrary units [a.u.]). PhTx application triggers increased Brp signal intensity in control but not in neto-αnull boutons.
(L and M) Normalized frequency distribution (L) and cumulative frequency (M) of BRP peak intensities reveal a rightward shift after PhTx application for the control animals (from 1 to 1.34, n = 18,312 peaks without and 18,756 with PhTx, p < 0.0001), but not for neto-αnull (from 1 to 0.97, n = 14,063 without and 17,940 with PhTx, p < 0.0001).
Scale bars: 10 μm. Data are represented as mean ± SEM. ***p < 0.001; ns, p > 0.05.

