Figure 4.
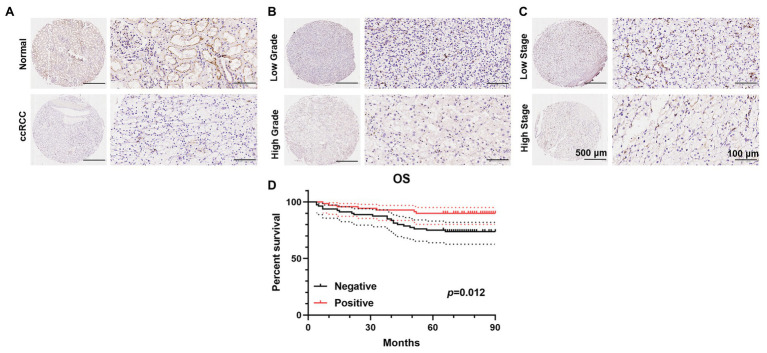
Immunohistochemical detection of PATJ protein in 150 ccRCC vs. normal tissues. The TMAs containing 150 ccRCC and 30 normal renal tissue specimens were immunostained with an anti-PATJ antibody and quantified. Representative fields of view (FOV) show the TMA cores of PATJ expression. (A) PATJ expression in normal renal specimens vs. ccRCC. (B) PATJ expressions in low grade vs. high grade ccRCC. (C) PATJ expressions in low stage vs. high stage ccRCC. (D) Patients with negative PATJ expression showed a significantly shorter OS than patients with positive PATJ expression (Log-rank test).

