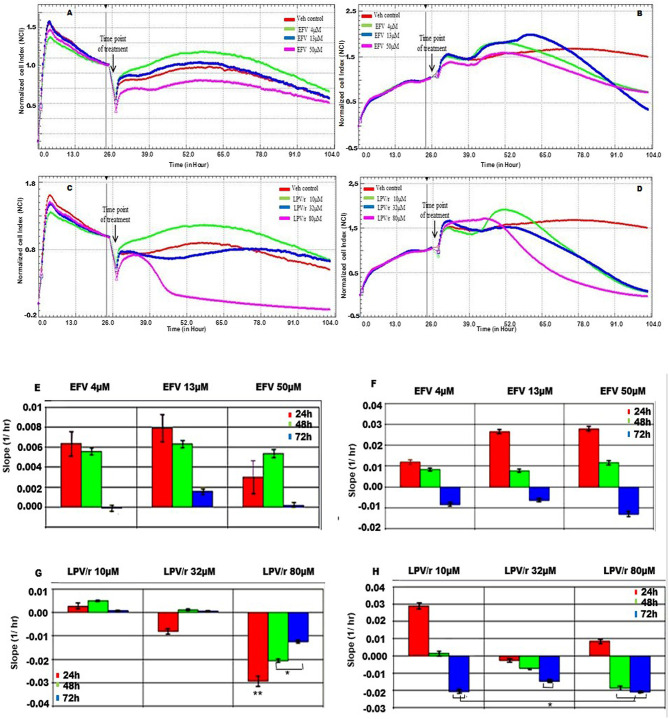
Figure 2.
MRC-5 and A549 cell proliferation in response to EFV and LPV/r. (A) Cell growth curve of MRC-5 cells treated with EFV (B) Growth curves representative of A549 cells treated with EFV. (C) MRC-5 growth curves representing cells treated with LPV/r. (D) Growth curves for A549 cells treated with LPV/r. The curves were plotted as a function of normalized CI vs. time in ARV treated vs. control. (E) The slope function of MRC-5 cells representing the response to EFV treatment over a 24 h time. (F) The slope function representing the response of A549 cells to EFV drug treatment at 24 h time intervals. (G) The slope function demonstrating MRC-5 cell response to LPV/r drug treatment, monitored at 24 h intervals. (H) A slope function representing A549 cells treated with LPV/r at 24 h intervals. The slope function represents the rate of cell detachment, and thus cell death for each of the drug concentrations. Results represent three independent experiments done in triplicate each. Error bars denote SEM; *p < 0.05; **p < 0.01.

