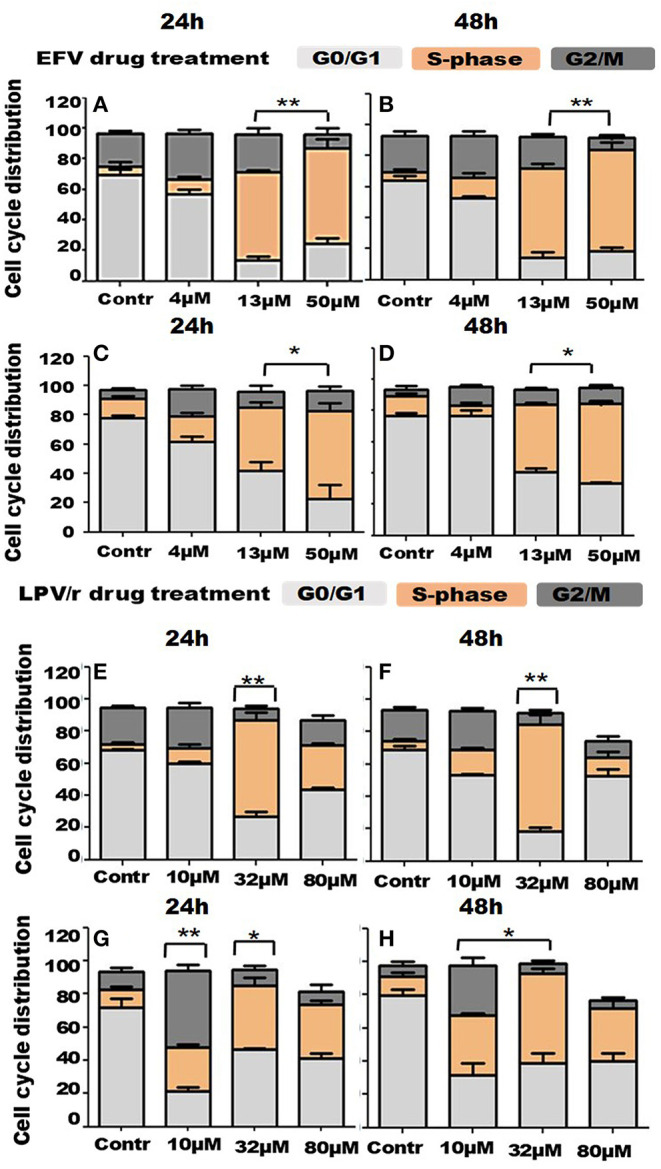
Figure 3.

Cell cycle distribution in response to ARV drugs. (A,B) Show bar graphs of EFV treated MRC-5 cells at 24 and 48 h. (C,D) Demonstrate bar graphs of A549 cells treated with EFV at 24 and 48 h. (E,F) Illustrate bar graphs of MRC-5 cells treated with LPV/r at 24 and 48 h, while (G,H) are bar graphs of A549 LPV/r treated cells at 24 and 48 h. The increase in S-phase, (S-phase arrest) observed here is statistically significant with p < 0.0 1. A significant increase in G2/M with p < 0.05 in A549 10 μM LPV/r treated cells is also evident. Error bars denote SEM; *p < 0.05; **p < 0.01.
