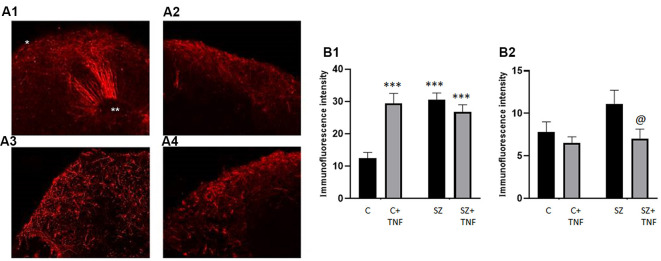
Figure 5.
Distribution of O4 Oligodendrocytes is affected in SZ and by TNFα. Panel (A) shows the florescent microscopy images of O4 antibody stained organoids (red). (A1)—C, (A2)—C+TNF, (A3)—SZ, (A4)—SZ+TNF. The radial scaffolding of migrating O4 cells emanating from ventricular rosettes towards the cortex in the C organoids (A1) was largely lost in C+TNF, SZ, and SZ+TNF organoids (A2–A4). In TNF-treated and in SZ organoids, conditions O4 oligodendrocytes were largely restricted to the cortical region. *CZ, **VZ. (B) Changes in O4+ immunofluorescence intensity induced by TNF and in SZ. A total of 16 organoids were analyzed, four from each condition; CZ—cortical region, IZ—subcortical region. A total of 128 ROIs were analyzed, with eight ROIs/image, four in CZ—cortical region, four in IZ—subcortical region. In each image, four additional ROIs were placed outside and use for background subtraction, but were not part of the total count. (B1)—CZ, two-way ANOVA: significant main effect of SZ F = 11.04, p < 0.05, TNF F = 8.088, p < 0.05, SZ × TNF interaction F = 19.81, p < 0.0001. (B2)—IZ, two-way ANOVA: significant effect of TNF F = 5.054, p < 0.05. LSD: ***different from C (p < 0.0001); @different from SZ (p < 0.05). In addition a three-way ANOVA of combined CZ and IZ showed significant main effects of SZ F = 13.67 (p = 0.0003), and organoid region F = 163.4 (p < 0.0001) as well as significant interactions, disease × TNF F = 20.1 (p < 0.0001), disease × organoid region F = 4.915 (p = 0.0285), TNF × organoid region F = 12.65 (p = 0.0005) and disease × TNF × organoid region F = 11.74 (p = 0.0008).

