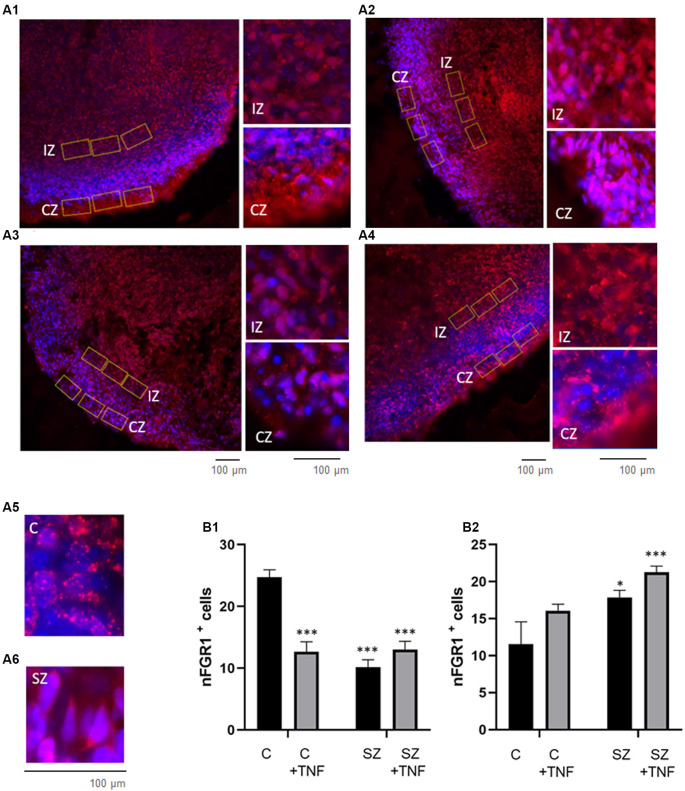
Figure 6.
Increases in nFGFR1 expression in subcortical cells and loss of nFGFR1 expression in cortical cells in SZ organoids and induced by TNF. (A) Immunostaining of FGFR1 (red) and co-staining with DAPI (blue). Organoids: (A1)—C, (A2)—C+TNF, (A3)—SZ, (A4)—SZ+TNF. In C organoids the nFGFR1 was highly expressed in the CZ cells and less expressed in the IZ cells. This pattern was reversed in SZ and TNF conditions, where nFGFR1 was depleted in the CZ and more highly concentrated in the IZ. Examples of different subcellular localization of FGFR1 staining: nuclear in C (A5) and cytoplasmic in C (A6), CZ organoid area. Red/pink speckles on a blue DAPI background represent nFGFR1, while cytoplasmic FGFR1 forms red cytoplasmic staining surrounding the blue DAPI stained nuclei. For each image, three of the same ROIs were placed in the CZ and three in the IZ. (B) Sixteen organoids, four from each condition and four images from each organoid were analyzed for the number of cells with nFGFR1 (colocalized FGFR1 and DAPI stains). For each image, the total number of cells with nFGFR1were counted in three ROIs in CZ (B1) and in three ROIs in the IZ (B2). Bars represent average total number of nFGFR1+ cells per image. (B1)—CZ—two-way ANOVA main effects of SZ F = 27.81 (p < 0.0001) and TNF F = 11.84 (p < 0.005); significant interaction between the SZ and TNF F = 30.48 (p < 0.0001). (B2)—IZ, main effect of SZ F = 10.71 (p < 0.005), TNF F = 0.641 (p < 0.05). LSD: *,***different from C p < 0.05, p < 0.0001.

