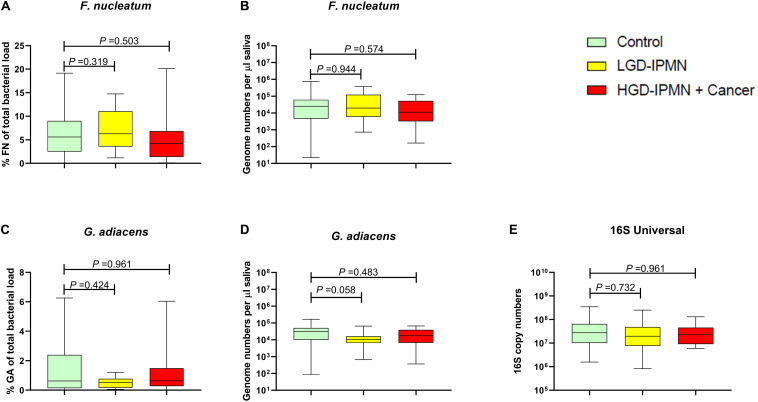
FIGURE 4.
Quantification of F. nucleatum and G. adiancens genome counts in saliva in patients of indicated diagnose group, expressed as relative of total salivary 16S copy count of the sample (A,C), or as per μl of sample (B,D). Total salivary bacterial 16S genome counts in indicated group (E). Statistical analysis was performed using Mann–Whitney U test.

