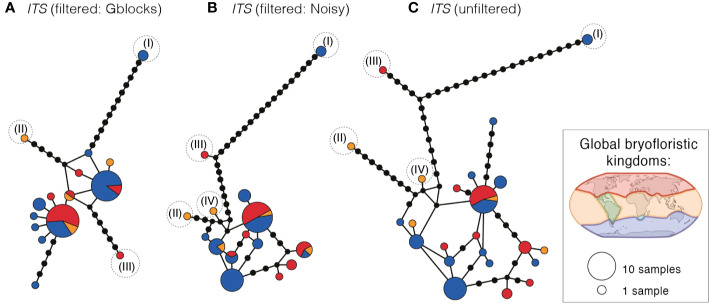
Figure 3.
Haplotype networks of ITS for Ceratodon purpureus, after treatment with (A) GBLOCKS, (B) NOISY or as (C) original data. Haplotype circle sizes and colors correspond to the number of specimens and globally recognized bryofloristic kingdoms (see legend; Schofield, 1992), respectively. Branches represent mutations between haplotypes, with mutations shown as 1-step edges. Numbers (I–IV) indicate the placement of the same samples falling in clades I–IV as resolved in the cpDNA data sets (see Figure 2).

