
Figure 4.
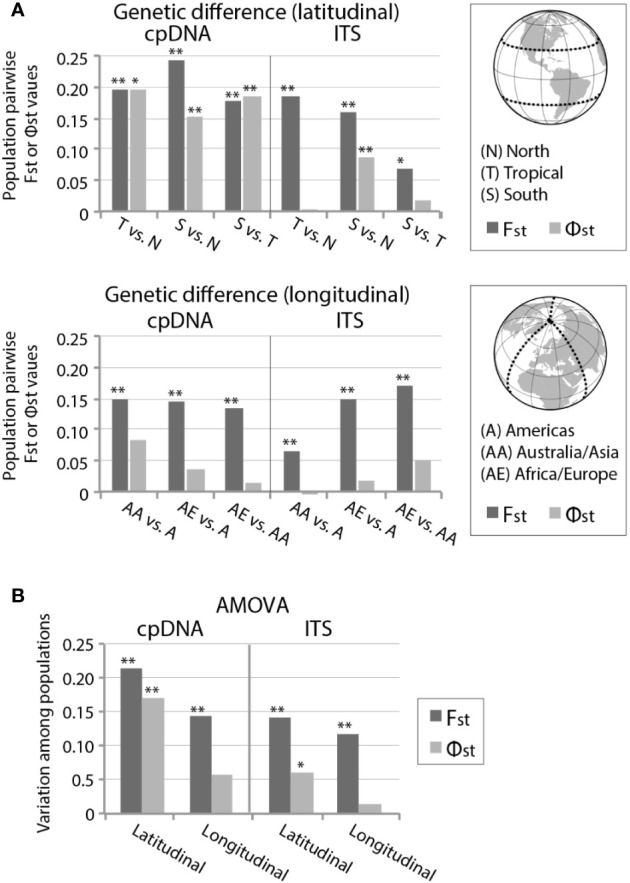
(A) Pairwise FST and ΦST values and (B) analysis of molecular variance (AMOVA) within Ceratodon purpureus populations based on latitudinal and longitudinal geographically divided areas, including samples from the “concatenated cpDNA” and GBLOCKS filtered ITS data set. For details see Tables S3–S5. For geographically divided areas see legend in (A). P-values are represented by * for P < 0.05 and ** for P < 0.01.