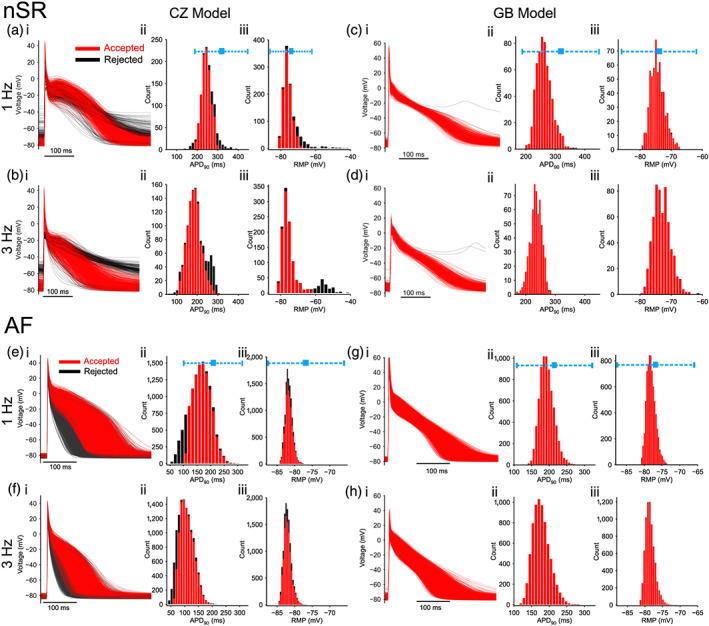
FIGURE 1.

Simulated action potentials (APs) for human atrial myocytes populations. (a–d) normal sinus rhythm (nSR) populations. (e–h) AF populations. Myocytes were paced at 1 Hz (panels a, c and e, g) and 3 Hz (panels b, d and f, h). The left panels (a, b, e, f) show data for Colman–Zhang (CZ) model while results from Grandi–Bers (GB) model are plotted on the right (c, d, g, h). In each panel, column (i) superimposed APs of the atrial populations; column (ii) and (iii) distribution of action potential duration and resting membrane potential, respectively. Action potential duration was measured at 90% repolarization (APD90). Rejected model variants following experimental data calibration are indicated in black. Ranges of experimental measurements (mean ± 3 × SD) are indicated in blue symbols and bars
