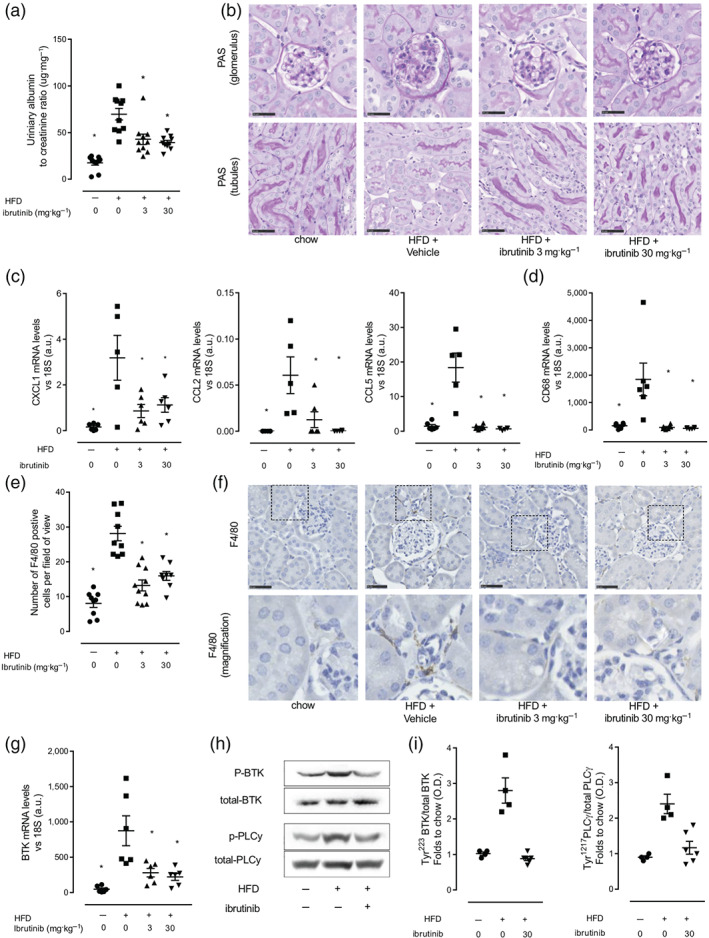
FIGURE 5.

Ibrutinib treatment prevents the development proteinuria in mice fed a HFD. (a) Urinary albumin to creatinine ratio (ACR). (b) Kidney sections were stained with periodic acid Schiff staining to assess histological changes. in vivo data (n = 9–10 per group) (c) Relative gene expression of CXCL1, CCL2, CCL5, and CD68 was assessed by qPCR and normalized to 18S. Data shown are individual values with means ± SEM; n = 5–6 per group. * P < 0.05, significantly different from HFD + Veh; one‐way ANOVA with Bonferroni post hoc test. (f) Macrophage infiltration was assessed by immunohistochemical staining for macrophage marker F4/80 and quantified (e); scale bars measure 50 μm. Inset images are 4× digital zoom. Data shown are individual values with means ± SEM; n = 8–10 per group. * P < 0.05, significantly different from HFD + Veh; one‐way ANOVA with Bonferroni post hoc test. (g) Relative gene expression of BTK was assessed by qPCR and normalized to 18S. Data shown are individual values with means ± SEM; n = 5–6 per group. * P < 0.05, significantly different from HFD + Veh; one‐way ANOVA with Bonferroni post hoc test. (h) Representative western blots for phosphorylation of Tyr223 on BTK in the kidney and normalized to total BTK; for phosphorylation of Tyr1217 on PLCγ in the kidney and normalized to total PLCγ and (i) quantified using densitometry. Data shown are individual values with means ± SEM; n = 3–6 per group. * P < 0.05, significantly different from HFD + Veh; one‐way ANOVA with Bonferroni post hoc test
