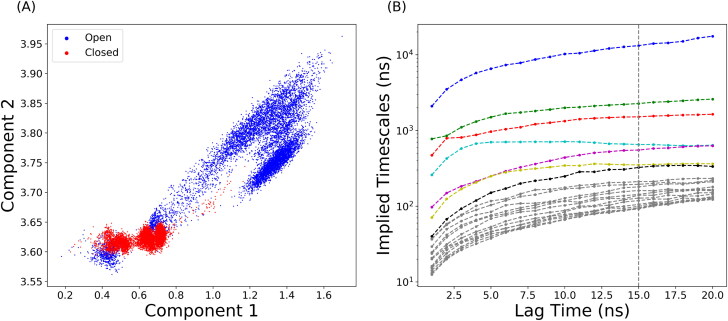
Figure 2.
Distribution of SARS-CoV-2 S glycoprotein simulations. (A) 2D protein conformation space using RMSD values with references both closed and partially open states. (B) Implied relaxation timescale of top 20 variables based on the data coordinates in the reduced map regarding with the different lag times as interval.

