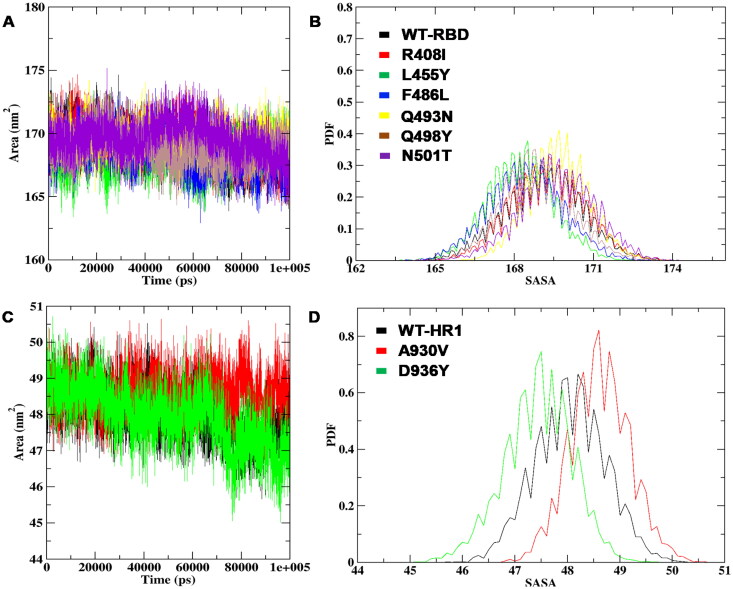
Figure 6.
SASA analysis of RBD and HR1 WT structures in the presence of mutations (A) SASA plot of RBD region with mapped mutations (B) The consistency probability energy plot of RBD WT and mutations (C) SASA fluctuations per residue variation for HR1 domain WT and mutations (D) The PDF plot representing the SASA average values on WT and mutants of HR1 domain at total simulation time.

