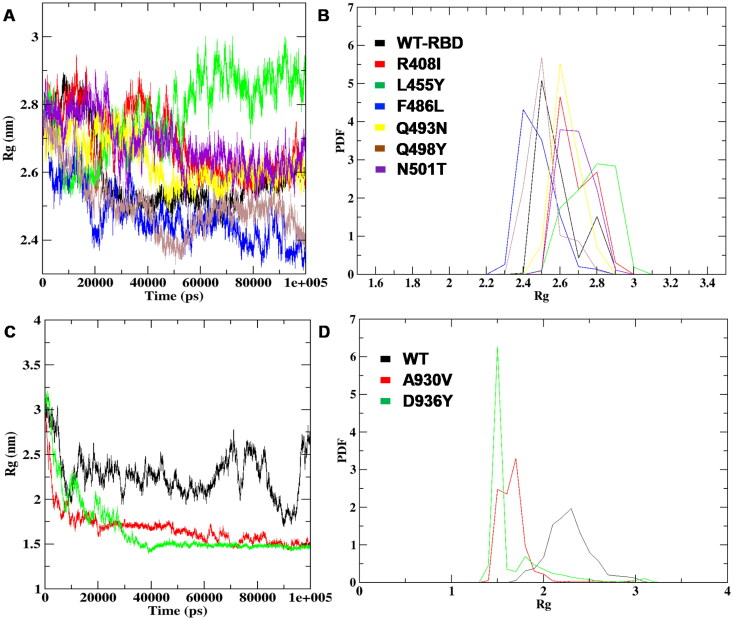
Figure 7.
Rg plots of RBD and HR1 domain WT and mutants structures (A) The radius of gyration consistency plot mapped to compare RBD-WT and mutants (B) RBD WT and mutant Probability distribution function of Rg (C) Radius of gyration plot annotated on HR1 domain WT and mutant structures (D) PDF plot representation between the HR1 domain WT and mutant structures.

