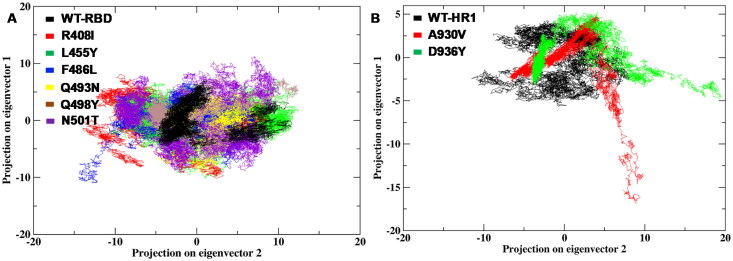
Figure 9.
The dynamic energy fluctuation plot between eigenvector 1 and vector 2 generated between both the systems (WT & mutants) of RBD and HR1 domain (A) Atomic number monitoring between eigenvector1 and vector2 of RBD region WT and mutant (B) The 2D projection plot between two eigenvectors for the conformational space of Cα-atom between HR1 WT and mutant structures.

