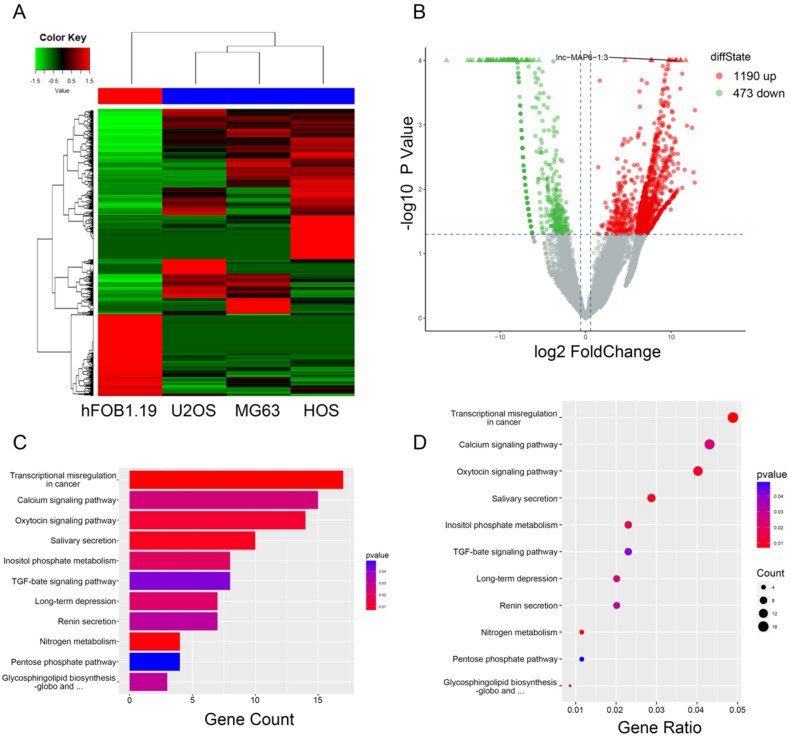
Figure 1.
Gene expression profile differences between the OS cell lines and the osteoblasts, and enrichment analysis of KEGG pathways for differentially expressed lncRNA/mRNAs. (A) Hierarchical clustering indicates lncRNA profiles. Red and green indicate high and low expression, respectively. In the heat map, the columns represent samples, and the rows represent respective lncRNAs. (B)Volcano plots were used to distinguish the differentially expressed lncRNAs. The vertical lines correspond to 1.5-fold difference and the horizontal line represents a P value of 0.05. (C and D) Pathway analysis based on the KEGG database.

