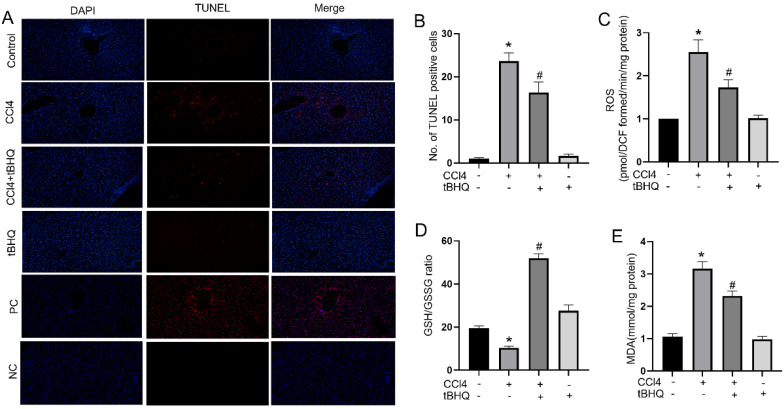
Figure 2.
Treatment of tBHQ reduced CCl4 induced apoptosis and oxidative stress in liver tissues. TUNEL staining displayed that the TUNEL positive cells (red) in the CCL4 group were increased compared to control group in liver tissues (A). CCL4+tBHQ group significantly displayed fewer TUNEL positive cells compared to CCL4 group (A). Single tBHQ and control group had no TUNEL positive cells (A). A statistical analysis of TUNEL positive cells was performed (B). Levels of ROS (C), GSH/GSSG ratio (D) and MDA (E). PC means positive control group. NC means negative control group. Data were expressed as mean ± SEM (n = 6). *p < 0.05 vs. control; #p < 0.05 vs. the CCL4 group.

