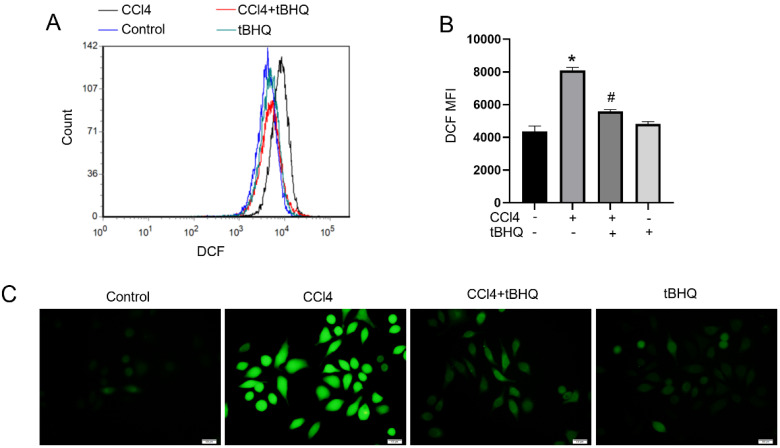
Figure 4.
Treatment of tBHQ decreases CCL4 induced production of ROS in cell line. Histograms of DCF fluorescence (A). Mean fluorescence intensity (MFI) of each group (B). Images were captured after DCFH-DA probe staining using fluorescence microscope (C). All experiments were performed three times independently. Data were expressed as mean ± SEM. *p < 0.05 vs. control; #p < 0.05 vs. the CCL4 group.

