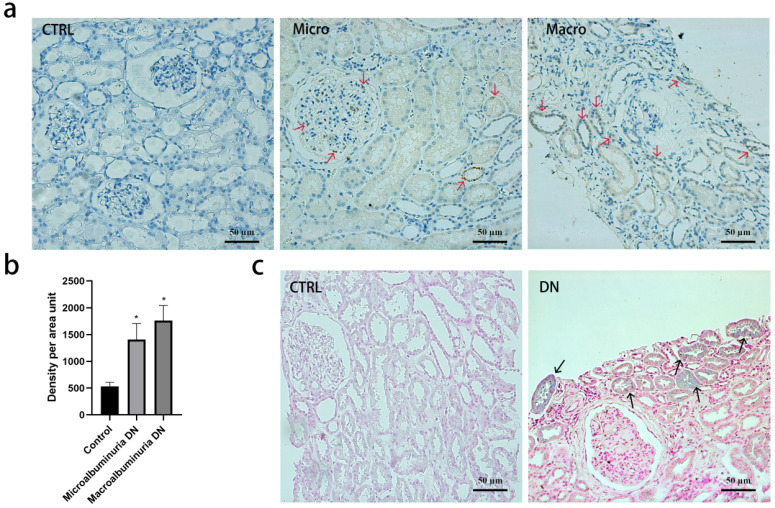
Figure 3.
Transferrin and iron staining in kidney biopsy specimens. (a) Tissue transferrin (red arrows) by immunohistochemistry in normal kidney tissue, diabetic kidney tissue with microalbuminuria or macroalbuminuria. 200×, Bar=50 μm. (b) Quantification of the transferrin staining shows a significant increase in diabetic kidney tissue compared with normal kidney tissue (*p <0 001, compared with control group). Experiments were performed with ten participants for each group, and the results are expressed as mean ± SD. (c) Tissue iron deposition (black arrows) by Perl's staining in normal kidney tissue and diabetic kidney tissue. 200×, Bar=50 μm.

