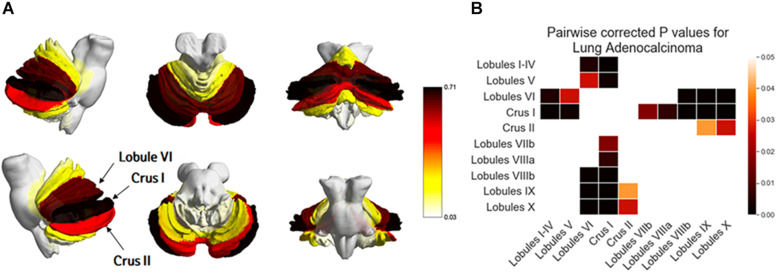
FIGURE 5.
Comparison of the frequency of brain metastases from adenocarcinoma by subregions of the cerebellum. Yellow regions indicate a low frequency of brain metastases (BMs) while black regions indicate a high BM frequency (A). Tukey’s HSD post-hoc pairwise test for the comparison of BM frequency between subregions of the cerebellum. All colored cells indicate a significant difference between two regions (p < 0.05). Darker colors indicate a greater difference in BMs between two regions (B).

