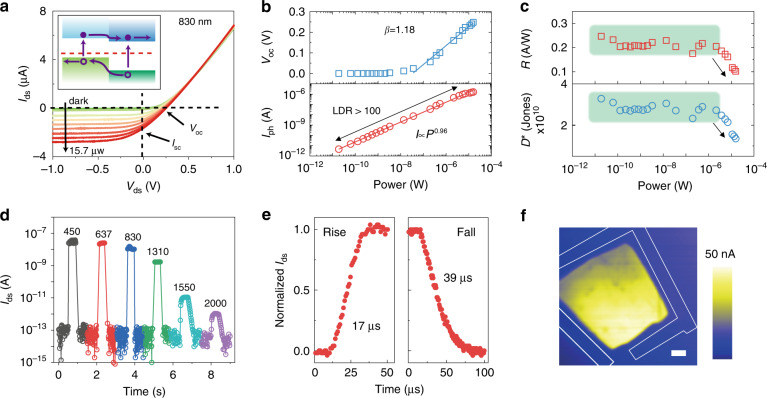
Fig. 3. Power and wavelength dependence of the p–n junction mode.
a Ids − Vds curves for incident laser powers from 0 to 15.7 μW. The inset shows a schematic of the photovoltaic mechanism for detecting visible to near-infrared radiation. b VOC and Iph as a function of the incident laser power. c Responsivity and detectivity as a function of the incident laser power. d Temporal response of the photocurrent under laser illumination of 450, 637, 830, 1310, 1550, and 2000 nm; all the powers are fixed at 80 nW. e Rise and fall times of the normalized photocurrent under zero bias measured by an oscilloscope. f Mapping of the photocurrent measured under scanning laser illumination at 830 nm; the yellow area corresponds to the overlap of the heterostructure. Scale bar, 5 μm.

