
Figure 2.
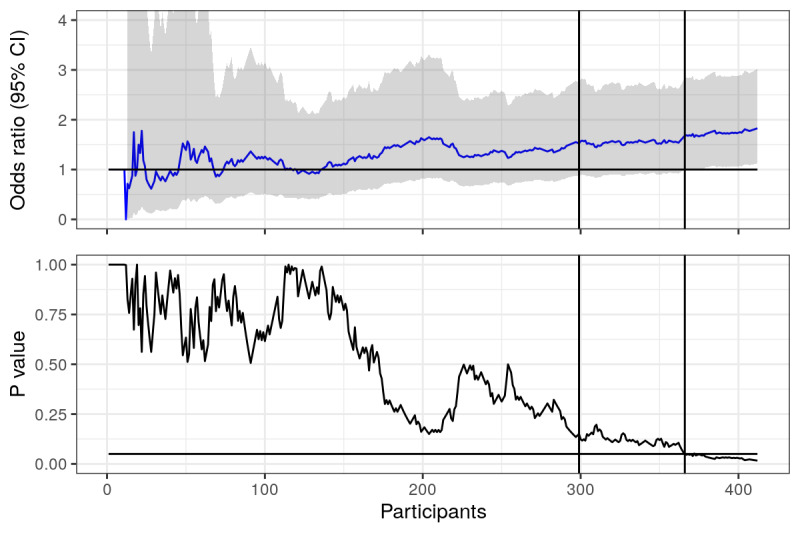
Point prevalence: odds ratios and P values calculated using actual data from trial, plotted over time (number of responders in the study). Horizontal lines represent null value (OR 1) and the .05 statistical significance line. First vertical line represents where the first 6 months of recruitment ended, second vertical line represents when point prevalence became statistically significant.