Figure 5.

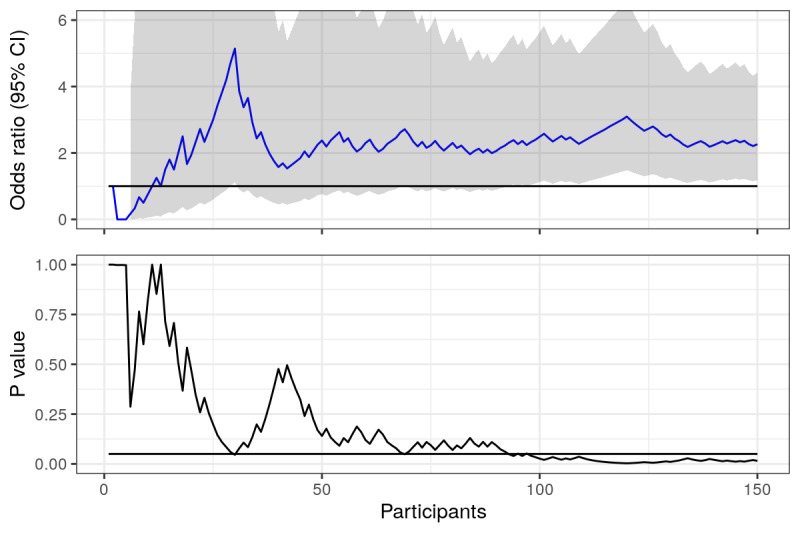
Pressed link in text message: odds ratios and P values calculated and plotted over time (number of participants in the study). Horizontal lines represent null value (OR 1) and the .05 statistical significance line.

Pressed link in text message: odds ratios and P values calculated and plotted over time (number of participants in the study). Horizontal lines represent null value (OR 1) and the .05 statistical significance line.