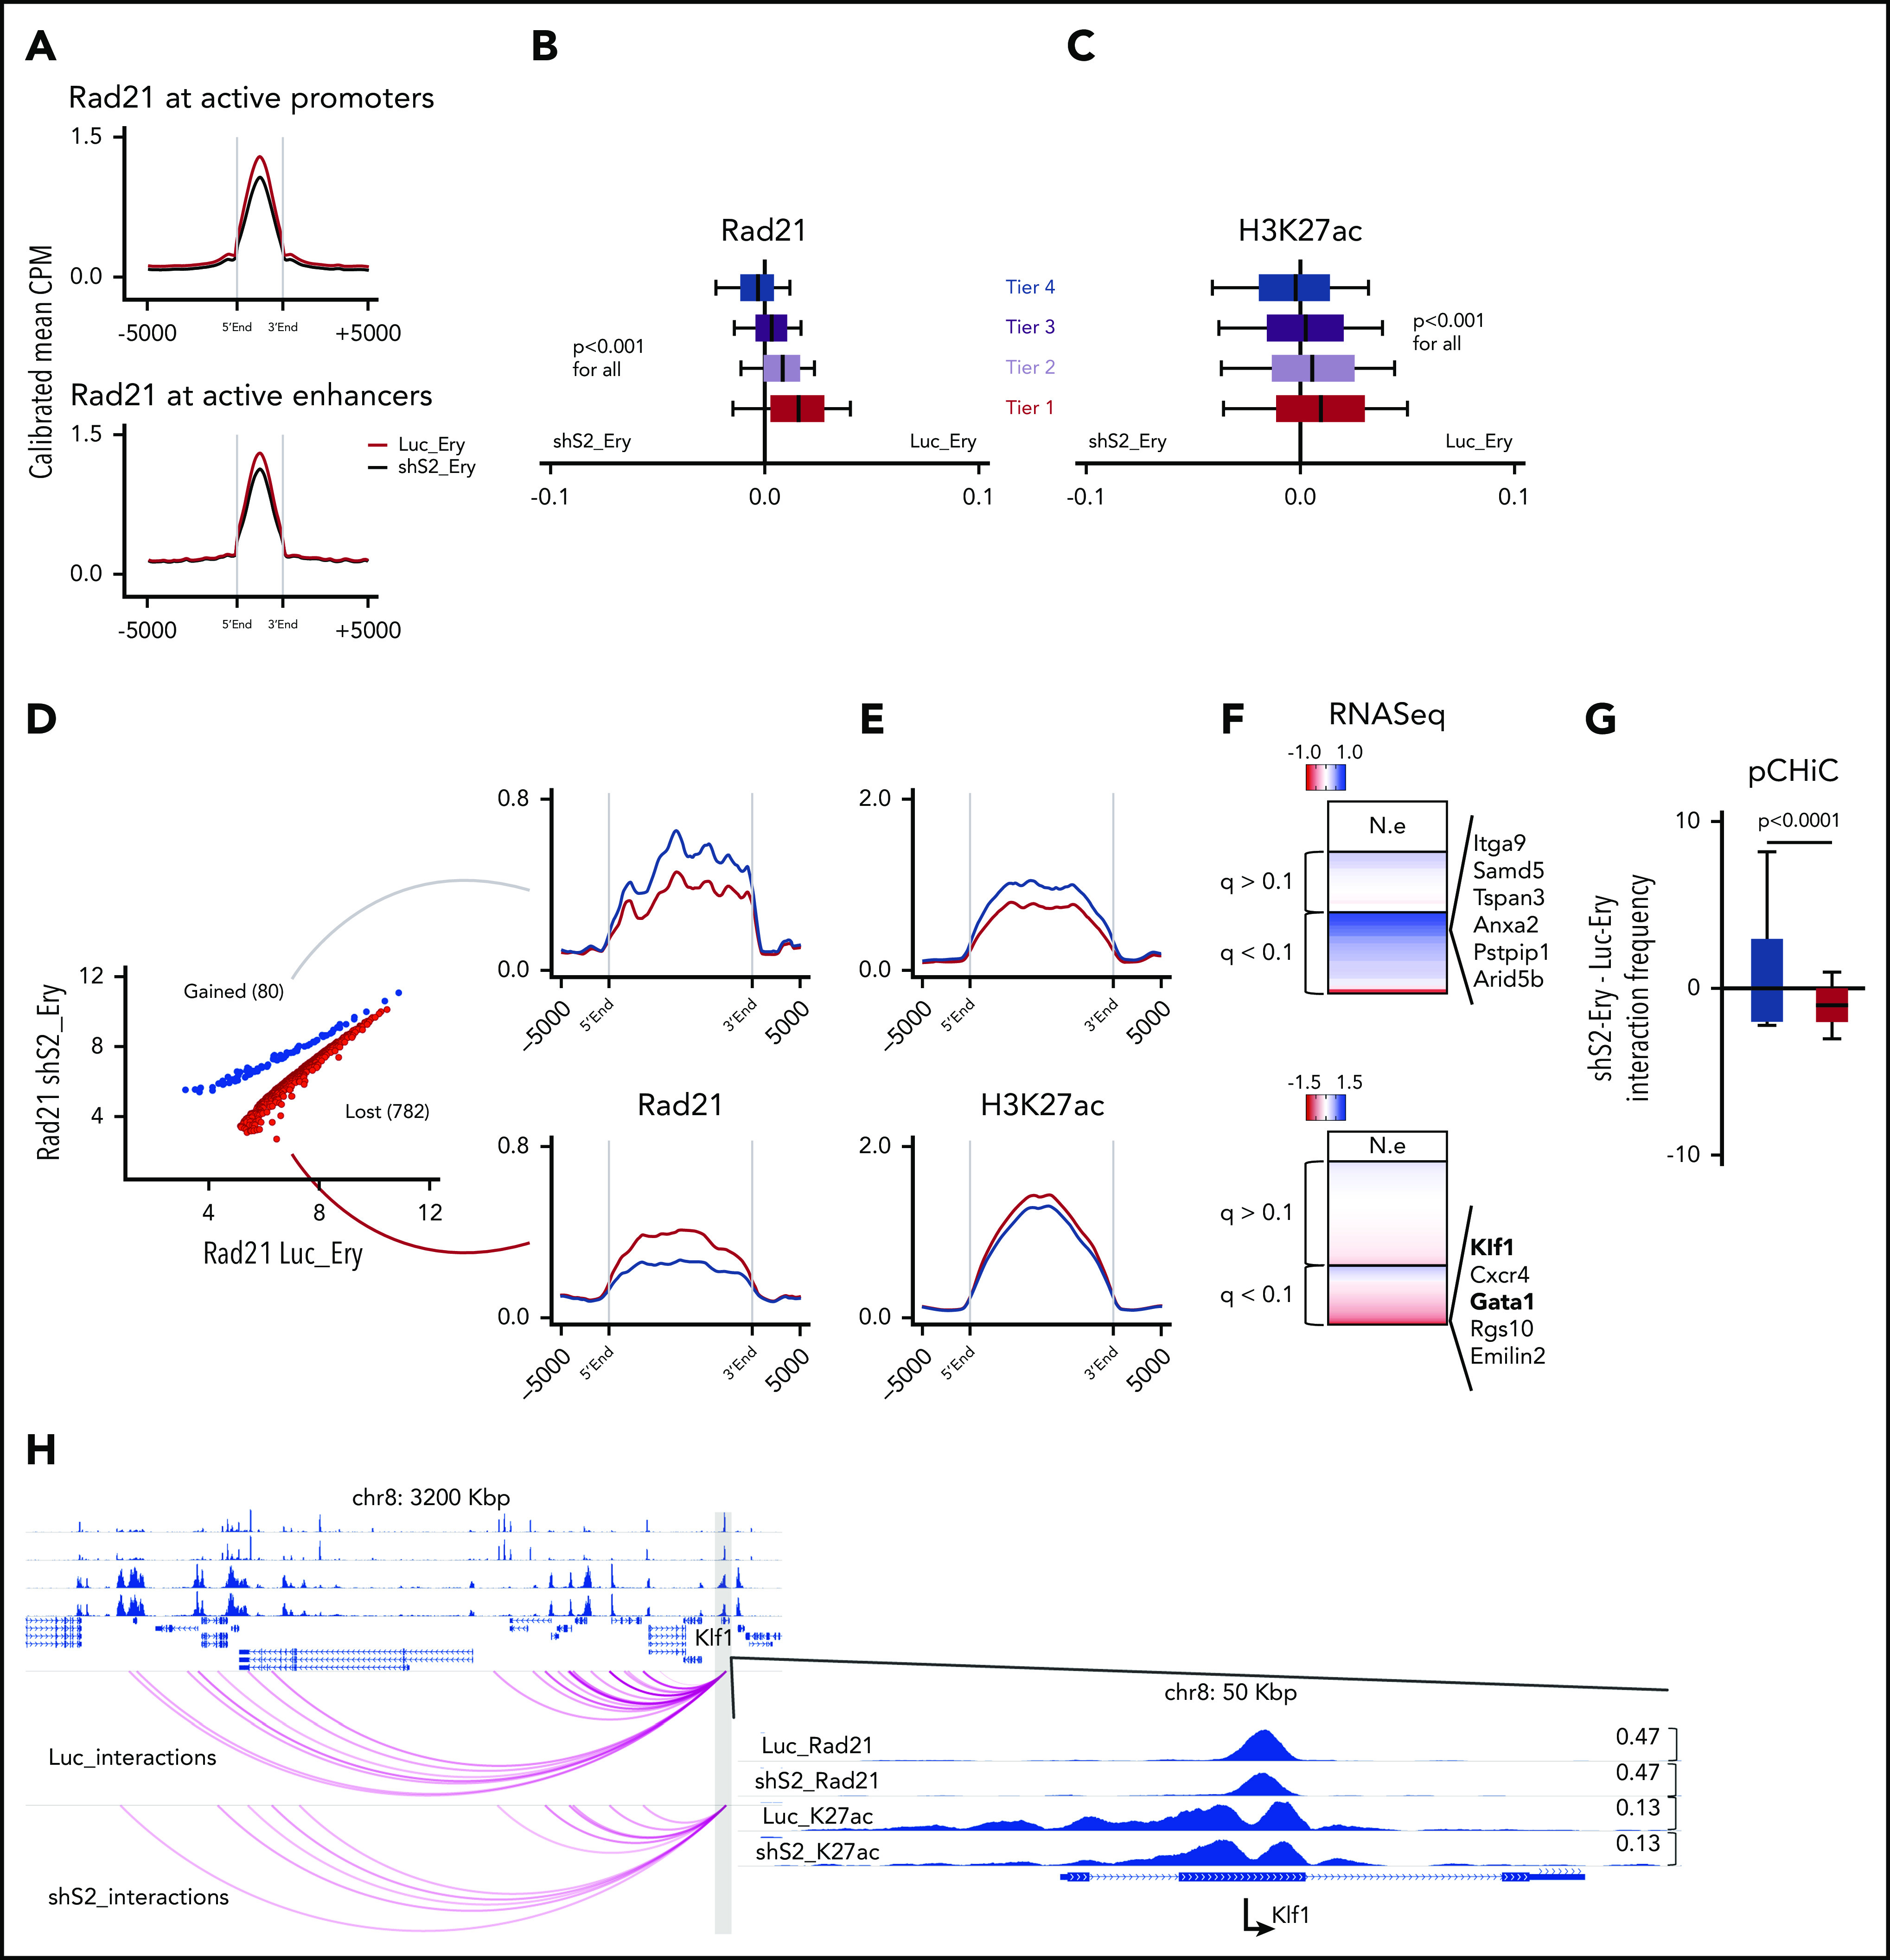
Figure 5.

Impaired erythroid differentiation directly relates to decreased cohesin complex binding at erythroid-specific genes. (A) Rad21 binding at active promoters or active enhancers in Luc_ery (red) and shS2_ery cells (black). To minimize global quantitative biases, the Rad21 signal was CPM normalized and internally calibrated to its signal at the insulator/other sites. Shown are means of 2 replicates (Luc1_ery, Luc2_ery, shS2_1_ery, shS2_2_ery). (B) Differential Rad21 binding in Luc_ery and shS2_ery cells at the indicated erythroid differentiation tiers from Figure 2B. Box plots to the left of 0 indicate increased binding following Stag2 knockdown and to the right indicate increased binding in control knockdown cells that follow normal erythroid differentiation. Shown are means of 2 replicates as described in panel A. (C) Differential H3K27ac binding as in Figure 2B. Shown are means of 2 replicates as described in panel A. (D) Differential Rad21 binding at active promoters between Luc_ery (red) and shS2_ery cells (blue). Shown are means of 2 replicates as described in panel A. (E) H3K27ac binding at the sites from panel D. Shown are means of 2 replicates as described in panel A. (F) Gene expression differences between Luc_ery and shS2-ery cellular states at the indicated sites from panel D. Genes that were enriched in Luc_ery were marked with negative values (shades of red), whereas genes that were enriched in shS2_ery were marked with positive values (shades of blue). Selected genes of interest are noted. (G) Interaction frequencies at the indicated sites from Fig 5D (at gained promoters [blue]; at lost promoters [red]) are shown as the difference of normalized significant interactions between shS2-Ery and Luc-Ery conditions. Shown are means of 2 replicates as described in panel A. (H) Example of Rad21 and H3K27ac binding dynamics, as well as interaction frequency between Luc_ery and shS2_ery at the Klf1 promoter (RNAseq log2foldChange −1.8). NE, not expressed.
