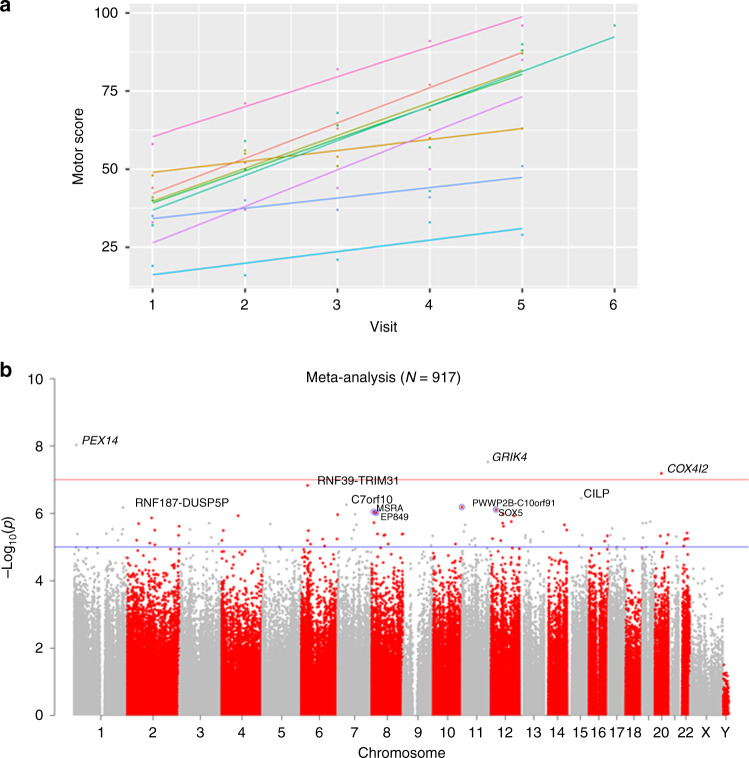
Fig. 1. EWAS of motor progression in manifest HD cases.
a The spaghetti plot illustrates how the motor score depends on the visit in Enroll-HD. To arrive at a measure of motor score progression (i.e., the rate of change in the motor score), we estimated the slope using a random-effects model with a random slope and intercept term. b The Manhattan plot visualizes the EWAS results of motor progression in manifest HD cases: log (base 10)-transformed meta-analysis p value (y-axis) versus the chromosomal location of each CpG (x-axis). The EWAS results were calculated with the biweight midcorrelation tests50. Fixed-effects meta-analysis (weighted by inverse variance) was performed to combine the EWAS results across blood data (N = 917) from Enroll-HD data 1, Enroll-HD data 2, and Registry data. All p values are two-sided and not adjusted for multiple comparisons. The blue and red horizontal lines correspond to suggestive significance (α = 1.0 × 10⁻⁵) and genome-wide significant levels (α = 1.0 × 10⁻⁷), respectively. Gene names are provided for CpGs (blue circles) with p < 1.0 × 10⁻⁶ with detailed summary statistics reported in Supplementary Data 3.

