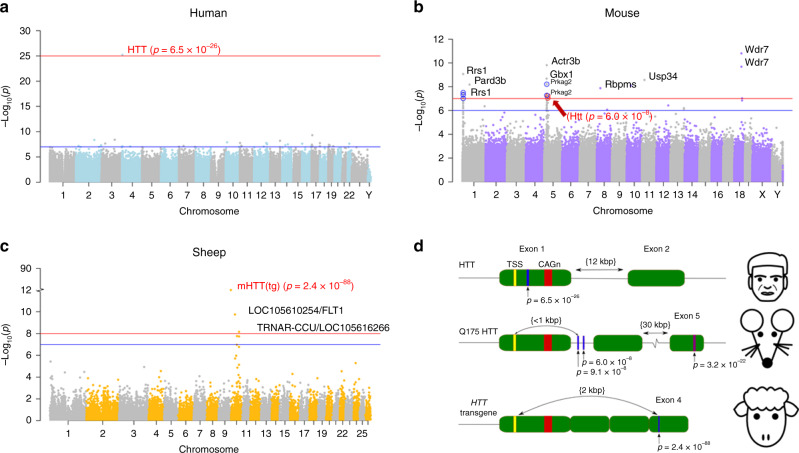
Fig. 4. Epigenome-wide association study (EWAS) of HD status in three species.
HDGEC status (carrier versus control) was related to DNA methylation data in three different species: a human blood, b mouse striatum/cerebellum, and c sheep blood. Each Manhattan plot reports minus log10-transformed p values (y-axis) versus chromosomal location. Each dot corresponds to a CpG. CpGs near HTT are marked in red. Human HTT is located in chromosome 4. Mouse Q175 knock-in in Htt is located on mouse chromosome 5. Sheep transgenic gene HTT is located on sheep chromosome 10. The blue horizontal lines correspond to genome-wide significance levels for a, c (α = 1.0 × 10⁻⁷) and a suggestive significance level for b (1.0 × 10⁻⁶); the red horizontal lines correspond to p < 1.0 × 10⁻³², p < 1.0 × 10⁻⁷, and p < 1.0 × 10⁻⁸ for a–c, respectively; the break in the y-axis indicates where the level of significance has been truncated for the purpose of visualization. b CpGs marked in blue on chromosome 1 are located in Ryrs1. CpGs marked in red and blue on chromosome 5 are located in Htt and Prkag2, respectively. d The alignment of significant CpGs (blue vertical lines) in the human (hg38), mouse (mm10) and sheep (oviAri4) HTT locus. The significant HTT/Htt CpGs (p < 1.0 × 10⁻⁷) are colored in blue with p values displayed below for human, mouse (RRBS methylation array), and sheep EWAS, respectively. The most significant CpG found using the mouse methylation array data are colored in magenta.

