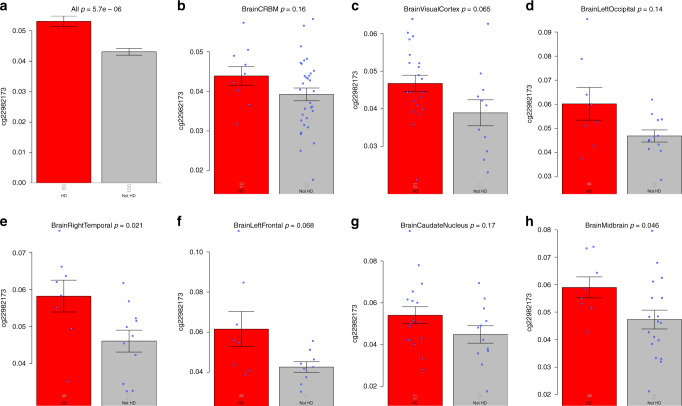
Fig. 5. Human HTT methylation in different brain regions.
The figure depicts the bar plots for the association of HD disease status with HTT cg22982173 in different brain regions (N = 67 from 26 HD versus 39 control individuals). We used n = 185 brain tissues (80 HD versus 105 controls) from seven brain regions: a bar plot based on all the seven brain regions combined. The results for a remain significant (p = 0.015) after adjusting for intra-individual correlations using a linear mixed-effects model. b–h Bar plots for each individual region: cerebellum (CRBM), visual cortex, left occipital, right temporal cortex, left frontal cortex, caudate nucleus, and midbrain, respectively. The blue dots correspond to individual observations that underlie the respective mean values. The y-axis of the bar plots depicts the mean of one standard error. The numbers of individuals per group are reported as gray numbers in each bar. The heading of each panel reports a nominal (unadjusted) two-sided p value (Kruskal–Wallis test).

