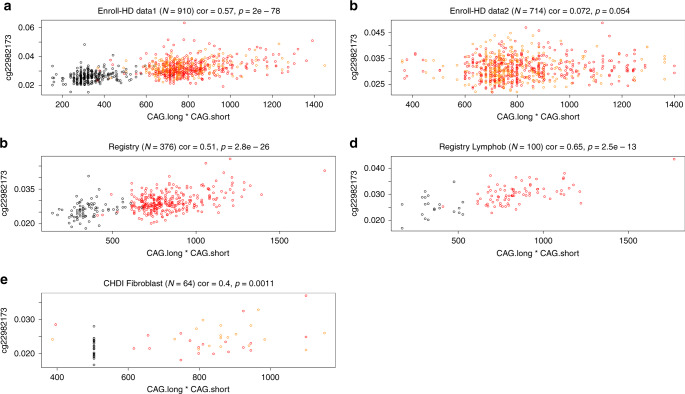
Fig. 6. Human HTT methylation versus the product of CAG lengths.
The product of the two CAG alleles (CAG.product = CAG.long × CAG.short) correlated with DNA methylation levels of the human HTT cg22982173 locus in a blood samples from Enroll-HD data 1, b blood samples from Enroll-HD data 2, c blood samples from the Registry-HD study, d lymphoblastoid lines from the Registry-HD study, and e fibroblast samples from the MTM study. The title of each panel reports the Pearson’s correlation coefficient and corresponding unadjusted p value. Fixed-effects meta-analysis (weighted by inverse variance) produced a meta-analysis p value of 9.1 × 10−123. Points in the scatter plots are colored by HD status: red = manifest HD, orange = pre-manifest HD, and black = control. Each plot reports a Pearson’s correlation coefficient and corresponding p value.

