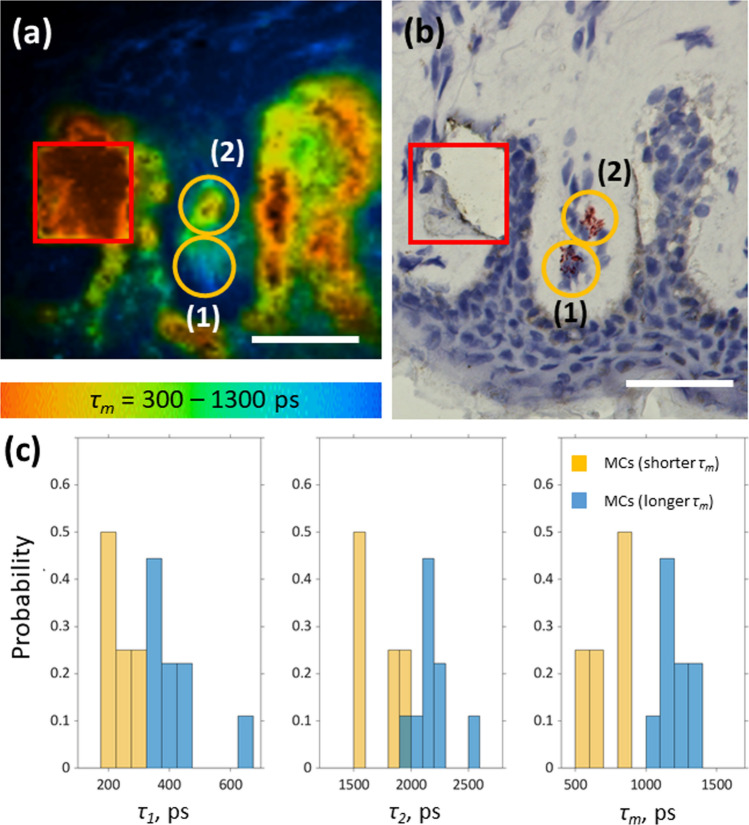
Figure 3.
MC ex vivo verification using TPE-FLIM and bright field microscopy. Side by side comparison of TPE-FLIM image (mean fluorescence lifetime τm in the 300–1,300 ps range) (a) and corresponding brightfield microscopic image after staining of human skin biopsy cryo-sections for MCs with tryptase and counter stained nuclei with Mayer's hemalum solution (b) and a histogram of TPE-FLIM parameters measured for the 17 staining-proved MCs (nine MCs with a longer τm and eight MCs with a shorter τm) (c). The MCs ((1) and (2) in a and b) are marked with orange ellipses and the laser-burned labels (28 µm × 28 µm) are marked in red. Images have been rotated and zoomed to match the same orientation and size. Scale bar: 30 µm.

