Figure 6.
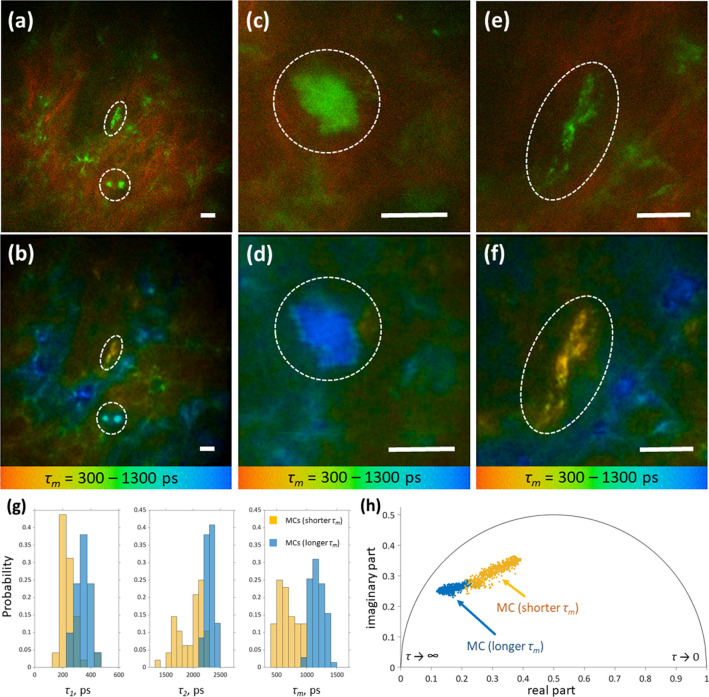
Differentiation of MC activation status in vivo. Top row: merged TPE-AF (green) and SHG (red) images of the human dermis measured in vivo without staining on the inner forearm of a 40 y. o. healthy male volunteer at 90 µm (a), 95 µm (c) and 90 µm depth (e). The corresponding TPE-FLIM images (bottom row, b, d, f), show the mean fluorescence lifetimes τm in a color gradient from 300 to 1,300 ps. The marked dotted areas show the MCs (a, b). Zoomed images of MCs with a longer τm (c, d) and shorter τm (e, f) are shown. Scale bar: 10 µm. Distribution of TPE-FLIM parameters τ1, τ2 and τm for two MC populations, such as MCs with a longer τm (n = 71, blue) and MCs with a shorter τm (n = 48, orange), measured in vivo without staining in the inner forearm skin of 28 human volunteers (g) and the phasor plot of one exemplary MC with a longer τm (blue points) and one MC with a shorter τm (orange points) measured in vivo and presented in (d) and (f) (h).

