Figure 7.
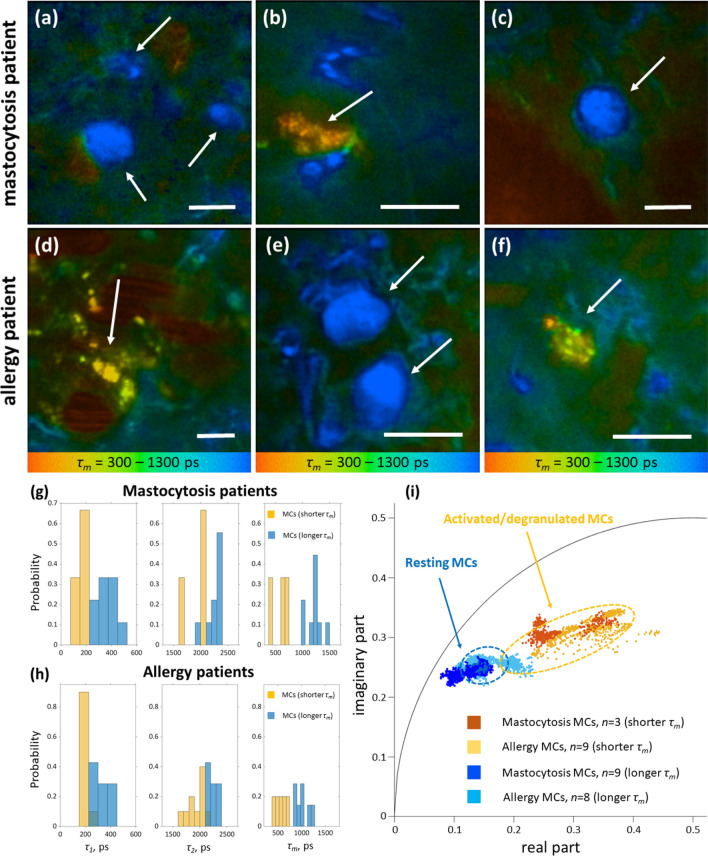
MC TPE-FLIM imaging of mastocytosis and allergy patients. TPE-FLIM typical MC images of human dermis in vivo, showing mean fluorescence lifetime τm in color gradient from 300 to 1,300 ps, in the disease-affected forearm area of the mastocytosis patient (a–c) and in the asymptomatic forearm area of the allergy patient (d–f). MCs are shown with arrows. The images were recorded at 760 nm excitation wavelength, 50 mW laser power and 6.8 s acquisition time in the depth of 90 µm. Scale bar: 10 µm. Distribution of TPE-FLIM parameters τ1, τ2 and τm for MCs in the skin of mastocytosis patients (n = 12) (g) and in the skin of allergy patients (n = 17) (h) and the phasor plot of the resting MCs with a longer τm (dark blue points—mastocytosis, n = 9; light blue points—allergy, n = 8) and activated/degranulated MCs with a shorter τm (dark orange points—mastocytosis, n = 3; light orange points—allergy, n = 9). The marked dotted areas show the distribution for resting (n = 6, blue) and activated/degranulated MCs (n = 6, orange) measured in vivo in healthy volunteers.

