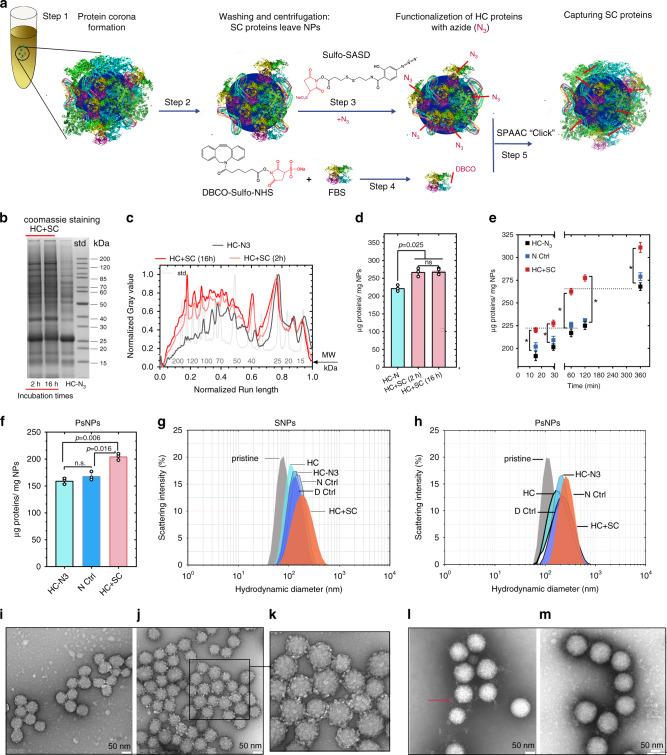
Fig. 1. SPAAC click-chemistry reaction and characterization of nanoparticle–corona complexes.
a Schematic representation of capturing SC proteins. After protein corona formation (steps 1 and 2), the HC proteins were modified with N3 by reacting with sulfo-SASD (step 3) followed by a SPAAC “click” reaction (step 5) with FBS-D proteins (prepared in step 4). b–d Effect of exposure time periods (2 and 16 h) in the click reaction evaluated by coomassie staining images (b) and densitometry analysis of SDS-PAGE gel (c), and quantification (d) of protein corona recovered from SNPs. The SDS-PAGE analysis was repeated three times independently with similar results. e Quantification of HC+SC proteins captured by click reaction on HC proteins formed on SNPs over different incubation times (15 min, 30 min, 1 h, 2 h, and 6 h). The SDS-PAGE image and densitometry analysis of the proteins are shown in Supplementary Fig. 5. f Quantification of HC+SC proteins captured by click reaction on PsNPs. Quantification data in d–f represented as the mean ± s.d. of three independent experiments (n = 3). For the multiple comparison, P value was calculated by one-way ANOVA with Tukey post hoc test without any adjustment. *P < 0.05; n.s., not significant (P > 0.05). g, h Hydrodynamic analysis of nanoparticle–corona complexes, SNPs (g), and PsNPs (h). i–m Transmission electron microscopy (TEM) analysis of the SNPs@HC (i), SNPs@HC+SC (j, k), PsNPs@HC (l), and PsNPs@HC+SC (m). TEM analysis was performed three times independently with similar results. Scale bar, 50 nm. FBS-D: FBS proteins modified with DBCO, pristine silica nanoparticles (SNPs), pristine polystyrene nanoparticles (PsNPs), hard corona (HC), hard corona modified with azide (HC-N3), FBS-D added to HC (D Ctrl), FBS added to HC-N3 (N3 Ctrl), FBS-D added to HC-N3 (HC+SC), HC-coated SNPs (SNPs@HC), and HC-coated PsNPs (PsNPs@HC). Source data are provided as a Source data file.

