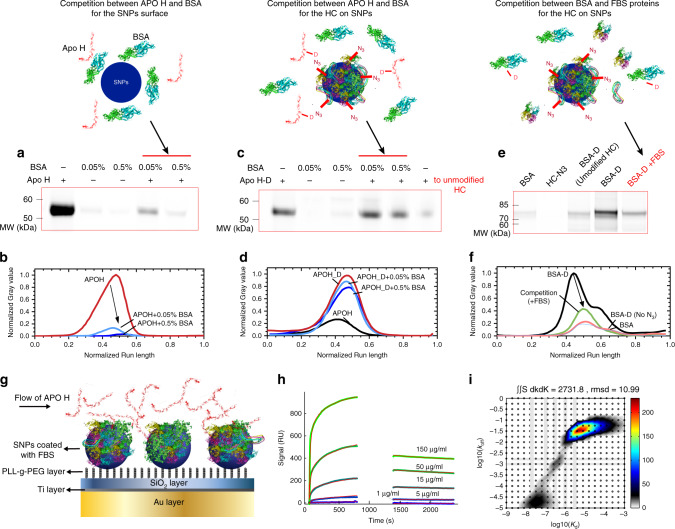
Fig. 4. CY5-labeled APOH and BSA competition for the surface of SNPs and HC.
a–d Fluorescence images and densitometry analysis of cut-out SDS-PAGE gels of the addition of 30 µg ml−1 of APOH-CY5 protein corona on SNPs (a, b) and 30 µg ml−1 of APOH-CY5-DBCO on HC-N3 on SNPs (c, d) formed in the presence and absence of either 0.05% or 0.5% BSA. APOH-CY5-DBSO was added to SNPs@HC without N3 as a control sample in (c). e, f The competition study between BSA and other FBS proteins for SNPs@HC-N3. Fluorescence image of a cut-out SDS-PAGE gel of proteins recovered from the corona formed on SNPs (e) and its densitometry analysis (f). In this experiment, BSA-CY5-DBCO alone or spiked with FBS proteins was added to SNPs@HC-N3. The addition of BSA-CY5 to HC-N3 and BSA-CY5-DBCO to HC without N3 was done as controls. The complete SDS-PAGE gels are shown in Supplementary Fig. 13. g–i Surface plasmon resonance (SPR) characterization of APOH interaction with SNPS@HC. The schematic representation of the SPR characterization is shown in (g). First, SNPs were immobilized on a protein-resistant polymer, PLL-g-PEG, creating an array of SNPs on a protein-resistant background. Then, protein corona was formed by injecting 1% FBS onto the immobilized NPs (shown in Supplementary Fig. 15). Subsequently, APOH was injected in different concentrations (1, 5, 15, 50, and 150 µg ml−1) (h). Two-dimensional fits were applied to the data to calculate Kd and Koff values for different populations of APOH binding to the SNPs@HC (i). For the fitting, data from around the rinsing were omitted, due to too few data points. The complete data of two technical repeats are shown in Supplementary Fig. 15. Source data are provided as a Source data file.

