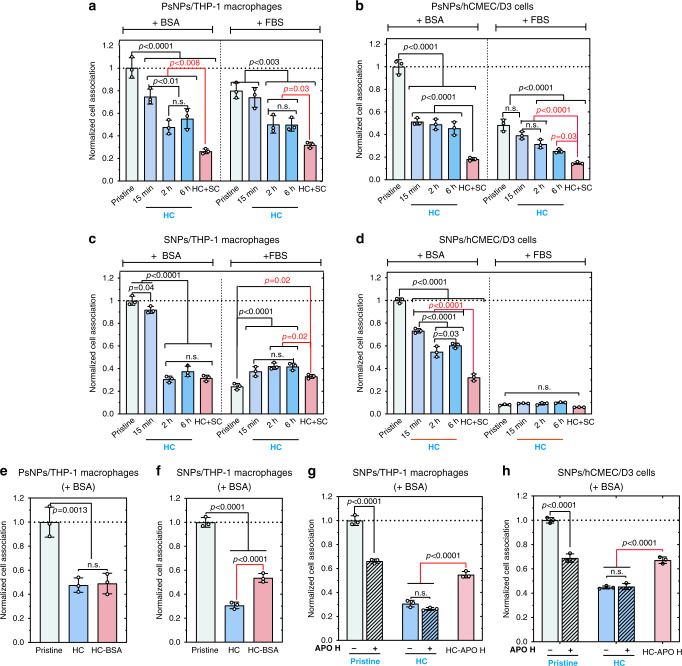
Fig. 5. Cell association of nanoparticle–corona complexes.
a–d Flow cytometry was used to quantify the cell association of 50 µg ml−1 of nanoparticle–corona complexes in THP-1 macrophages (PsNPs, a and SNPs, c) and hCMEC/D3 cells (PsNPs, b and SNPs, d). The cells were exposed to the pristine NPs, coated with HC formed over different FBS exposure times (15 min, 2 h, and 6 h), and with HC + SC, for 4 h in RPMI containing BSA or FBS. e, f THP-1 macrophages were exposed to PsNPs, PSNPs@HC, and PsNPs@HC-BSA (BSA is cross-linked on HC by using a click reaction) (e) and SNPs, SNPs@HC, and SNPs@HC-BSA (f) for 4 h in RPMI. g, h THP-1 macrophage cells (g) and hCMEC/D3 cells (h) were exposed to SNPs or SNPs@HC for 4 h in RPMI containing BSA with or without 30 µg ml−1 APOH. The cells were also exposed to SNPs@HC_APOH (APOH is cross-linked on HC by using a click reaction). The flow cytometry data were normalized to the pristine nanoparticle values in the RPMI supplemented with BSA. Bars show mean ± s.d. of three biologically independent experiments. For the multiple comparison in (a–d), P value was calculated by two-way ANOVA with Tukey post hoc test without any adjustment. P value in (e–h) was calculated by one-way ANOVA with Tukey post hoc test. n.s., not significant (P > 0.05). The cell gating data, which were used to identify single cells, are shown in Supplementary Fig. 16. Source data are provided as a Source data file.

