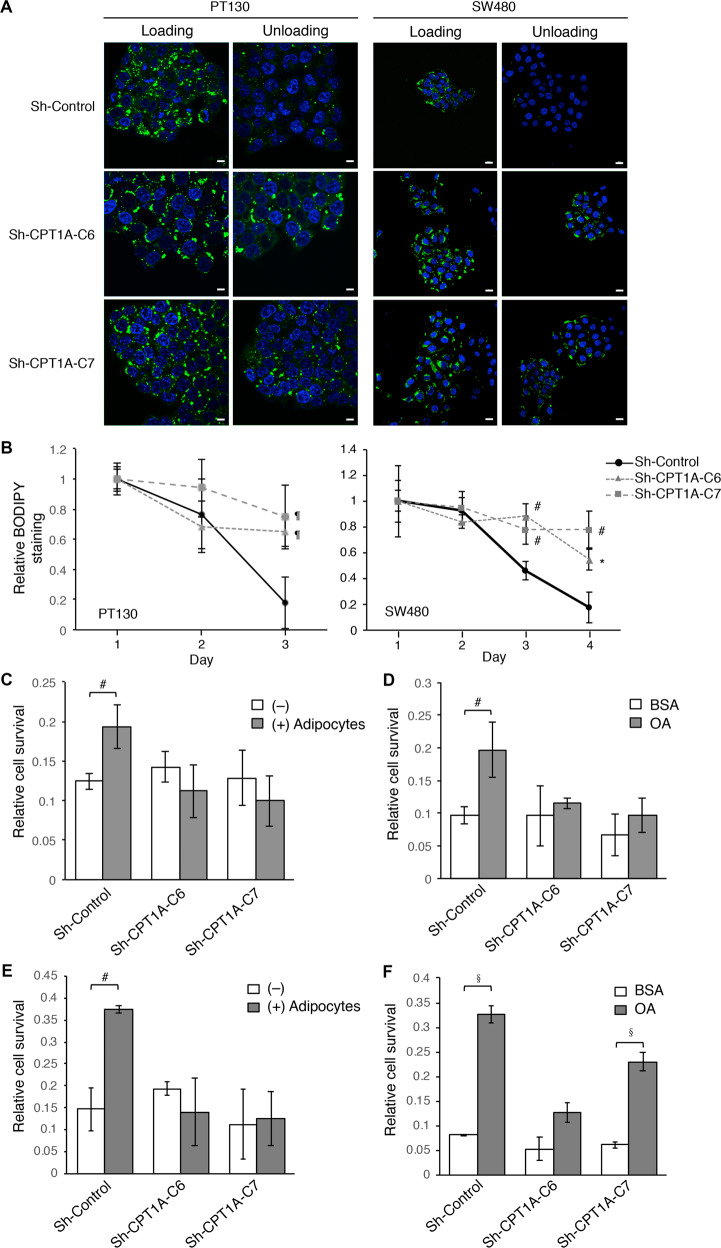
Fig. 3. Knockdown of CPT1A impairs fatty acid utilization and cell survival under nutrient deprivation conditions.
a Stable control (sh-Control) and CPT1A knockdown (sh-CPT1A-C6 and sh-CPT1A-C7) PT130 and SW480 cells were incubated with OA for 24 h (loading) and subsequently allowed to grow in regular growth medium for additional 24 or 48 h for PT130 and SW480 cells, respectively (unloading). Representative confocal images of cells stained with BODIPY 493/503 (green) and DAPI (blue). Scale bar, 100 μm. b Control and CPT1A knockdown PT130 and SW480 cells were incubated with OA for 24 h (day 1) and subsequently were stained with BODIPY 493/503 at indicated time points (days 2–4). The fluorescence intensity was measured using a fluorescence spectrophotometer as readout for relative lipid contents in cells. Data represent the mean ± SD (n = 3, #p < 0.05, *p < 0.01, and ¶p < 0.0001). c and d Control and CPT1A knockdown PT130 cells were co-cultured with adipocytes c or pretreated with OA d for 24 h and subsequently cultured in EBSS for additional 48 h. The relative cell survival was measured using crystal violet staining. Data represent the mean ± SD (n = 3, #p < 0.05). e and f Control and CPT1A knockdown SW480 cells were co-cultured with adipocytes e or pretreated with OA f for 24 h and subsequently cultured in EBSS for additional 48 h. The relative cell survival was determined. Data represent the mean ± SD (n = 3, #p < 0.05 and §p < 0.001).

