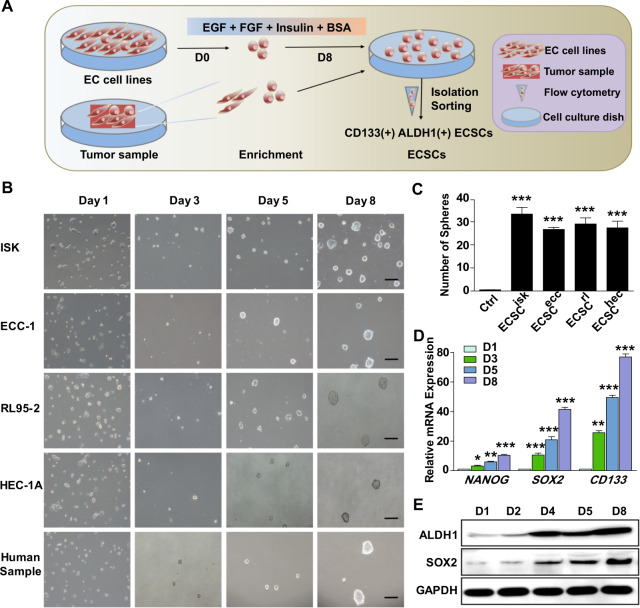
Fig. 1. The isolation and identification of ECSCs by cell morphology and stemness gene analysis.
a Schematic representation of the method of ECSC isolation. b Morphology of ECSCs isolated from different EC cell lines and human samples on days 1, 3, 5 and 8 (scale bar = 25 μm). c The numbers of spheres produced from different cells were analysed. d qRT-PCR analysis of stemness genes (NANOG, SOX2 and CD133) in ECSCisk. Data are shown as the mean ± SEM (N = 3). *P < 0.05, **P < 0.01, and ***P < 0.001 vs. Day 1. e Immunoblotting findings of ALDH1 and SOX2 in ECSCisk on days 1, 2, 4, 5 and 8.

