Fig. 3.

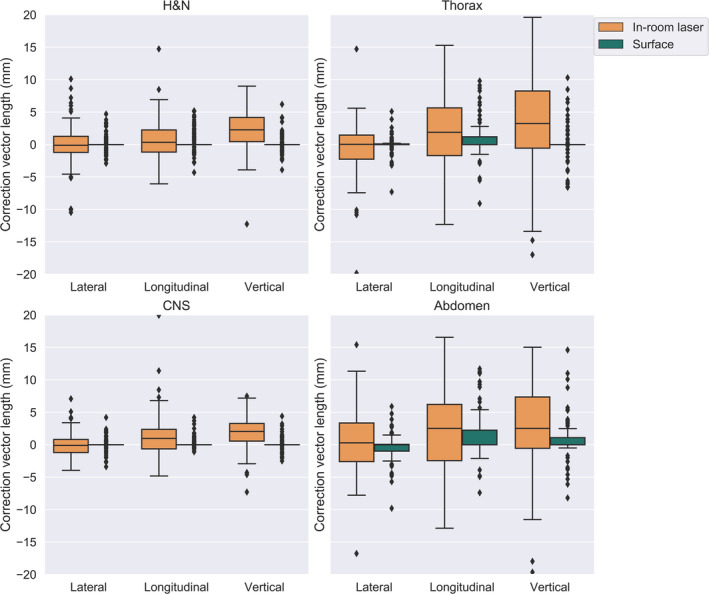
[Setup correction per axis and image modality] The residual error for surface scanning and the residual error for in‐room lasers, plotted per axis and treatment site. The residual error was assessed from the setup correction with megavoltage computed tomography to CT. Shown as a box‐and‐whisker plot, where the mid‐line represents the median (line), the interquartile range (box) and 1.5 times past the quartile range (outer line) and outliers (black point)
