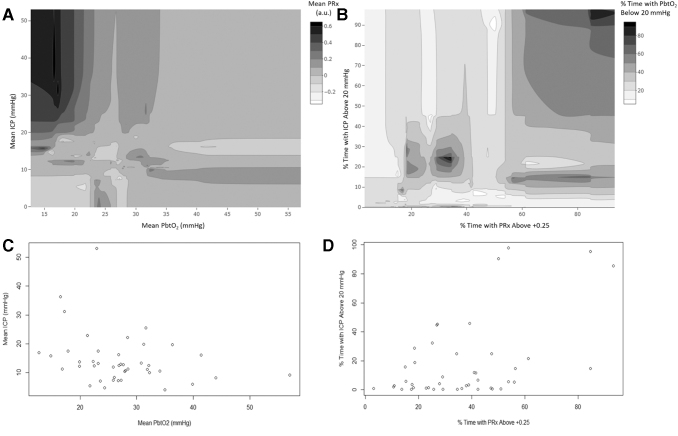
FIG. 1.
Multi-variable contour plots: ICP, PbtO2, and PRx. (A) Contour plot of mean ICP, PbtO2, and PRx, demonstrating grossly impaired PRx values, during high ICP and low PbtO2. (B) Contour plot of % time with ICP >20 mm Hg, % time with PbtO2 < 20 mm Hg, and % time with PRx > +0.25, again highlighting that extreme impairment in cerebrovascular reactivity and ICP lead to reduction in PbtO2 values. (C) Data density plot for A. (D) Data density plot for B. Mean and % time values were derived across the patient's entire recording period. a.u., arbitrary units; ICP, intracranial pressure; MAP, mean arterial pressure; PbtO2, brain tissue oxygen, PRx, pressure reactivity index (correlation between slow-waves of ICP and MAP).

