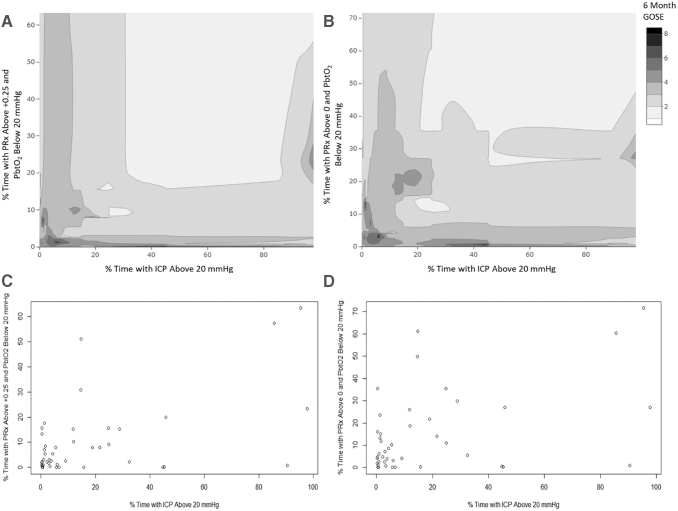
FIG. 2.
Cohort contour plots: % time ICP >20, % time PRx >0/+0.25 and PbtO2 < 20 mm Hg, and 6-month Glasgow Outcome Scale –Extended (GOSE). (A) Contour plot of % time with ICP >20 mm Hg, % time with PRx > +0.25/ PbtO2 < 20 mm Hg, and 6-month GOSE. (B) Contour plot of % time with ICP >20 mm Hg, % time with PRx >0/ PbtO2 < 20 mm Hg, and 6-month GOSE. (C) Data density plot for A. (D) Data density plot for B. Note the superior outcomes (i.e., higher GOSE scores) for more time spent with lower ICP and PRx and higher PbtO2. Mean and % time values were derived across the patient's entire recording period. ICP, intracranial pressure; MAP, mean arterial pressure; PbtO2, brain tissue oxygen; PRx, pressure reactivity index (correlation between slow-waves of ICP and MAP).

