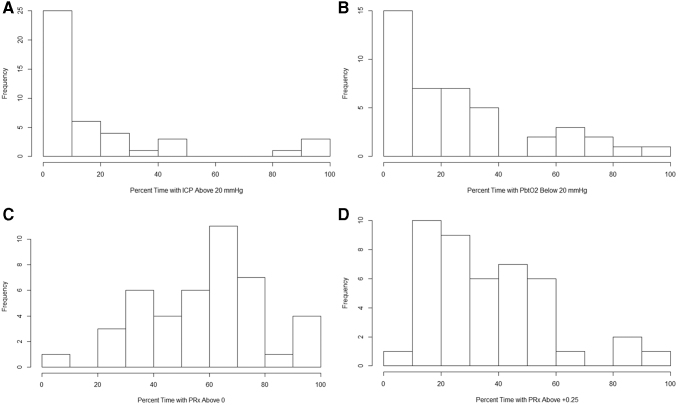
FIG. 3.
Cohort histogram plots - % time with ICP, PbtO2, and PRx beyond threshold. (A) Histogram of % time with ICP >20 mm Hg. (B) Histogram of % time with PbtO2 < 20 mm Hg. (C) Histogram % time with PRx above 0. (D) Histogram % time with PRx > +0.25. Mean and % time values were derived across the patient's entire recording period. Frequency, number of patients; ICP, intracranial pressure; MAP, mean arterial pressure; PbtO2, brain tissue oxygen; PRx, pressure reactivity index (correlation between slow waves of ICP and MAP).

