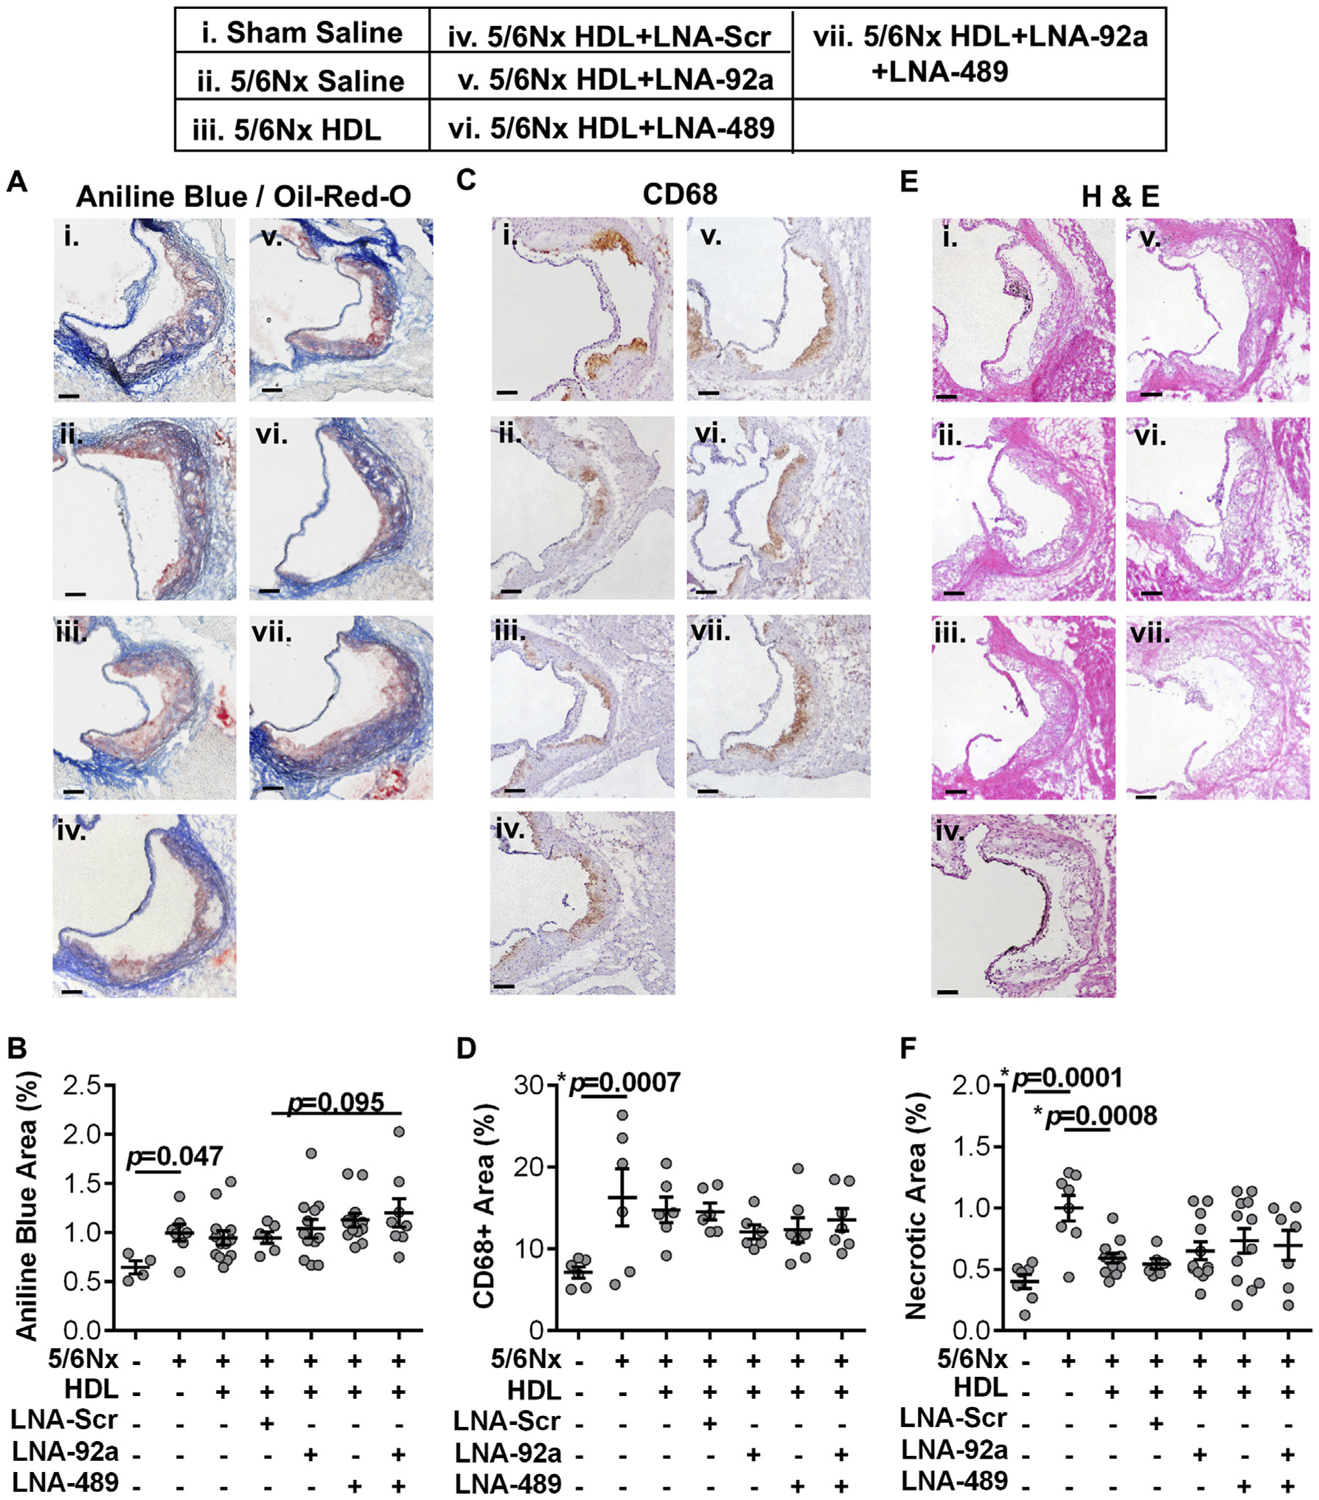
Fig. 3.

Characterization of atherosclerotic lesions. (A and B) Histological images of aortic cross-sections from treated Apoe−/−;5/6Nx mice and quantification of collagen with Aniline Blue normalized to lesion area (Oil-Red-O, ORO). N = 4–13. (C and D) Immunohistochemical images of aortic cross-sections from treated Apoe−/−;5/6Nx mice and quantification of CD68+ inflammatory cells (e.g. macrophages). N = 6–7. (E and F) Histological images of aortic cross-sections from treated Apoe−/−;5/6Nx mice and quantification of necrotic area by H&E staining. N = 6–12. One-way ANOVA with Bonferroni correction α = 0.008. Scale bars represent 100 μm.
