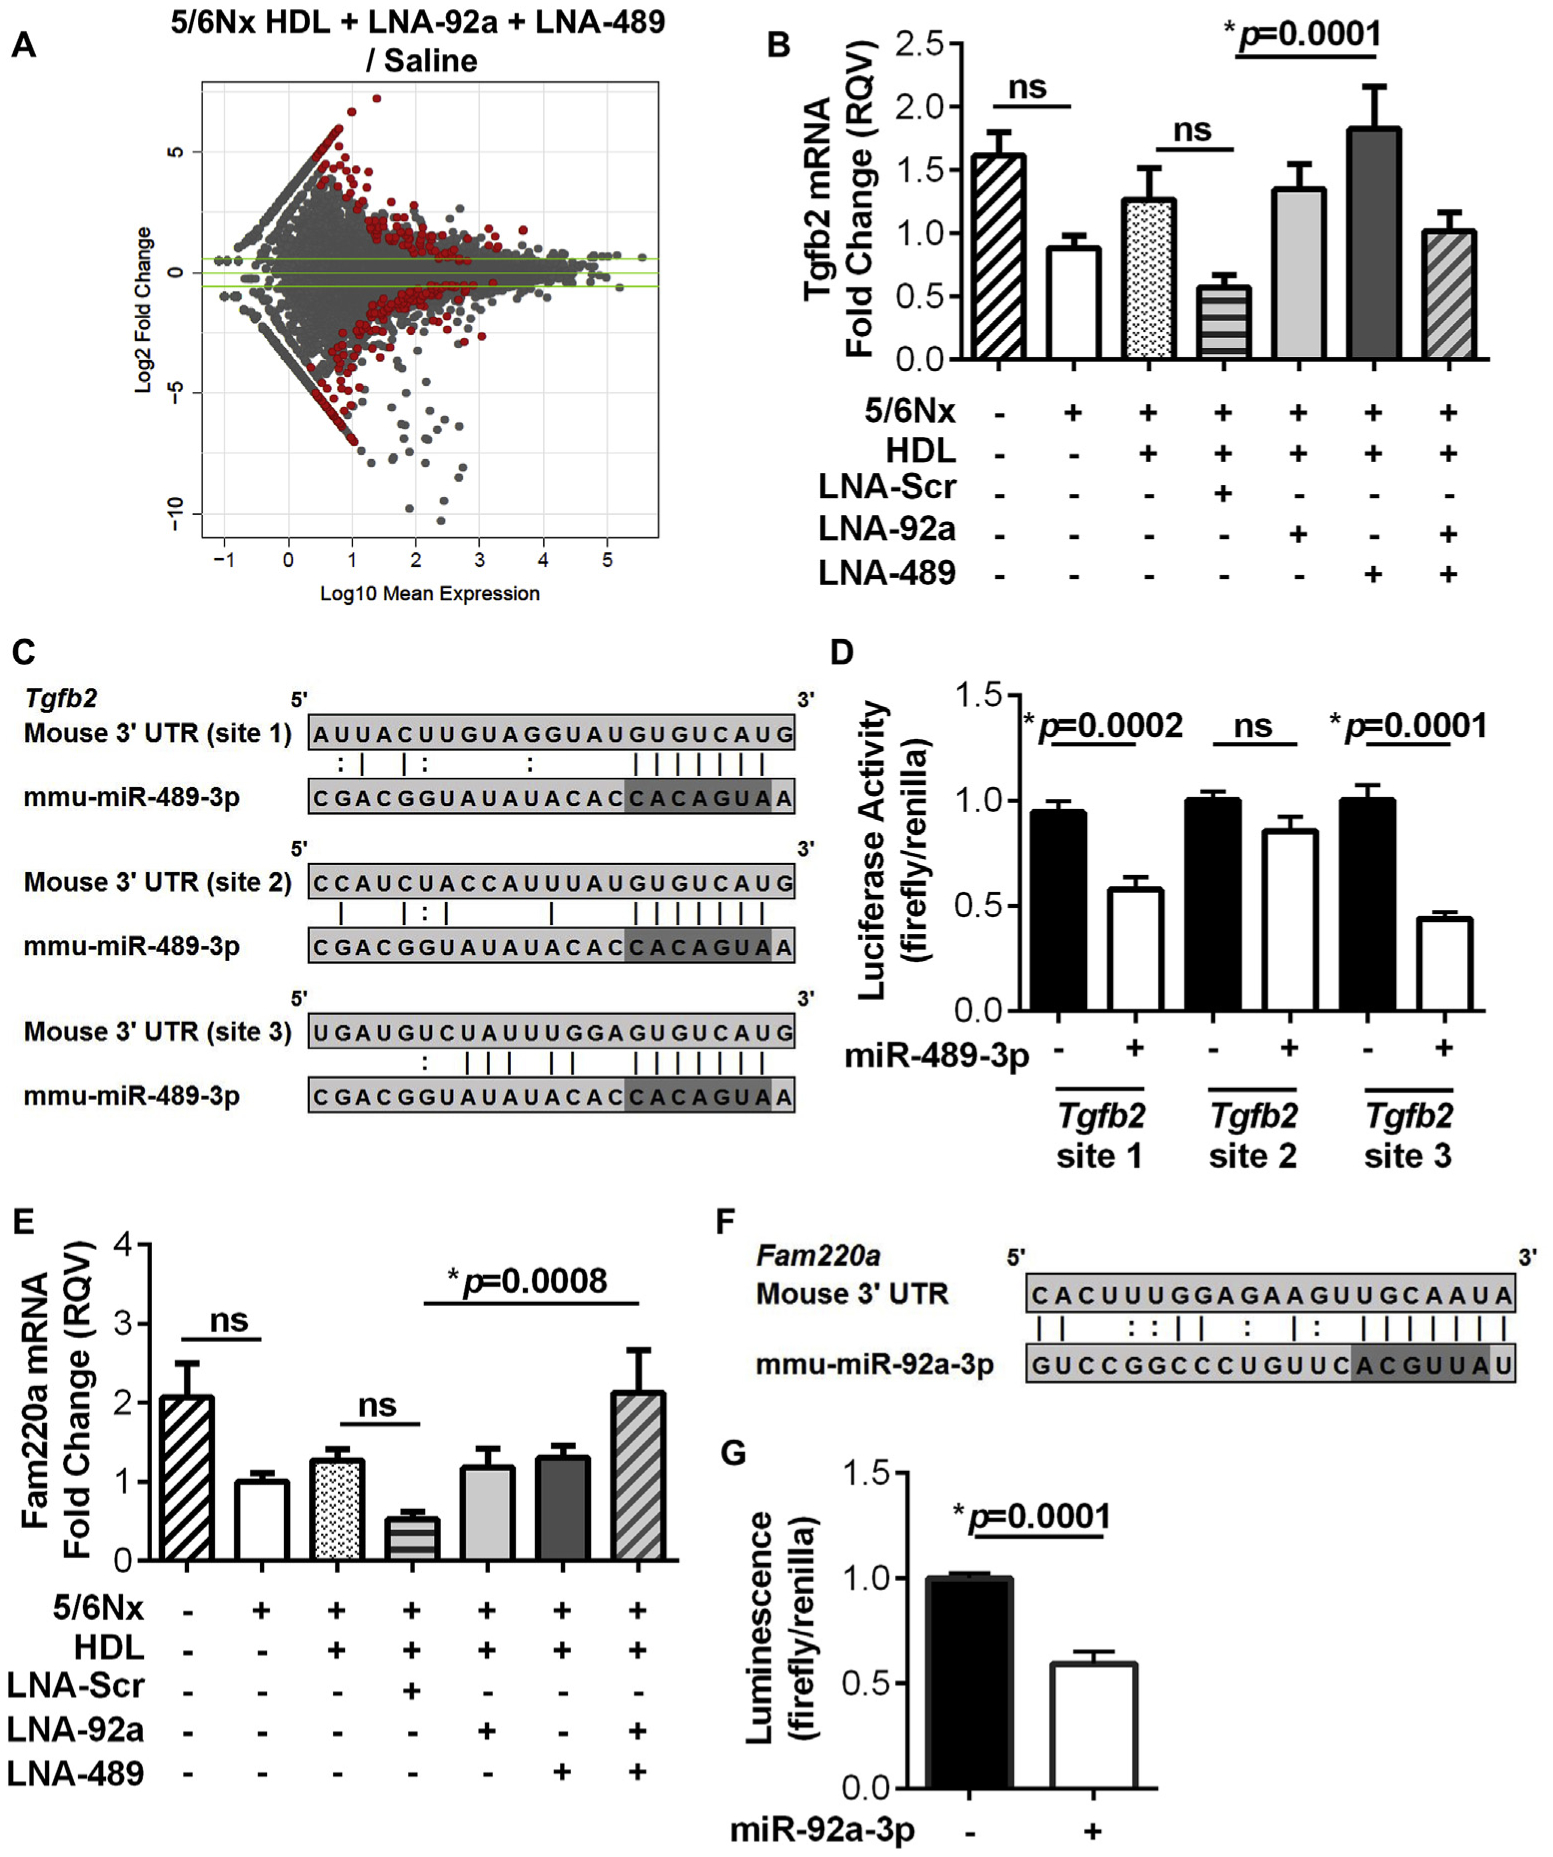
Fig. 4.

Dual inhibition of miR-92a-3p and miR-489–3p alter endothelial gene expression in CKD-associated atherosclerosis. (A) MA plot of the log10 DeSeq2 normalized mean expression and the log2 fold change of aortic endothelial gene expression for HDL + LNA-92a + LNA-489 compared to saline control with significantly altered genes highlighted in red. Absolute fold change ≥1.5 indicated by the green lines. N = 4. (B) Real-time PCR quantification of aortic endothelial Tgfb2 mRNA levels in Apoe−/−;5/6Nx cohort. N = 11–16. (C) Putative mmu-miR-489–3p target sites within Tgfb2 3′ UTR. (D) Gene reporter (luciferase) assays with dual transfection of miR-489–3p mimics and luciferase reporter plasmids harboring the predicted miR-489–3p target sites from the mouse Tgfb2 3′ UTR in HEK293 cells. N = 11–12. (E) Real-time PCR quantification of aortic endothelial Fam220a mRNA levels in Apoe−/−;5/6Nx cohort. N = 11–16. (F) Putative miR-92a-3p target sites within Fam220a 3′ UTR. (G) Gene reporter (luciferase) assay with dual transfection of miR-92a-3p mimics and luciferase reporter plasmids harboring the predicted miR-92a-3p target sites from the mouse Fam220a 3′ UTR in HEK293 cells. N = 11–12. For real-time PCR analysis, one-way ANOVA with Bonferroni α = 0.01 were used. For luciferase assays, Mann-Whitney non-parametric tests were used.
