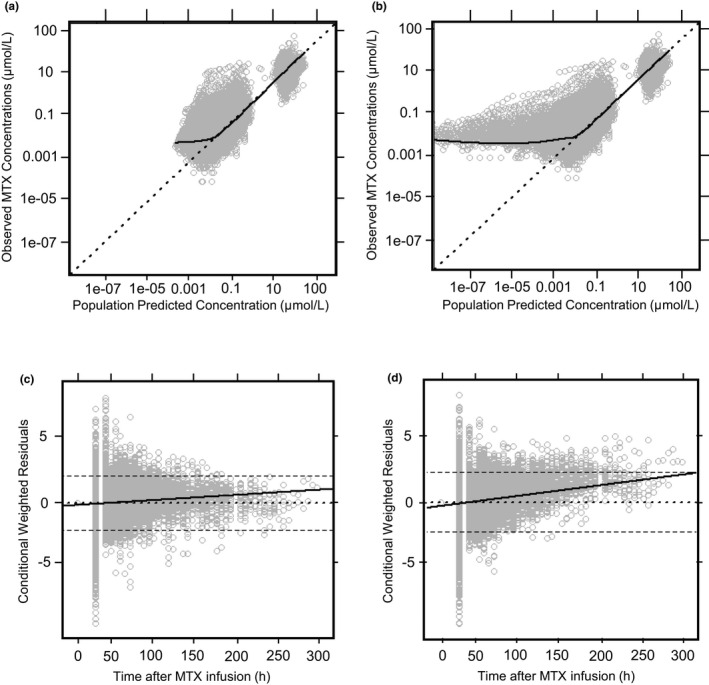
Figure 2.

Comparing the goodness‐of‐fit plots for two‐compartment and three‐compartment structural models. The three‐compartment model showed significantly less bias at lower predicted concentrations (a) compared to the two‐compartment model (b), which displayed overestimation of clearance. The three‐compartment model displayed improved predictive performance at later times following a methotrexate (MTX) infusion (c) compared with the two‐compartment model (d). A total of 1,494 weighted residuals (4.7%) were found outside of ± 2 conditional weighted residuals (CWRES). The CWRES displayed a normal distribution with 649 residuals below −2. For a and b, the dotted line represents the line of identity. For c and d, the dotted line represents the zero‐line. The dashed lines represent the two SDs. The solid black line represents the trend line for all figures.
