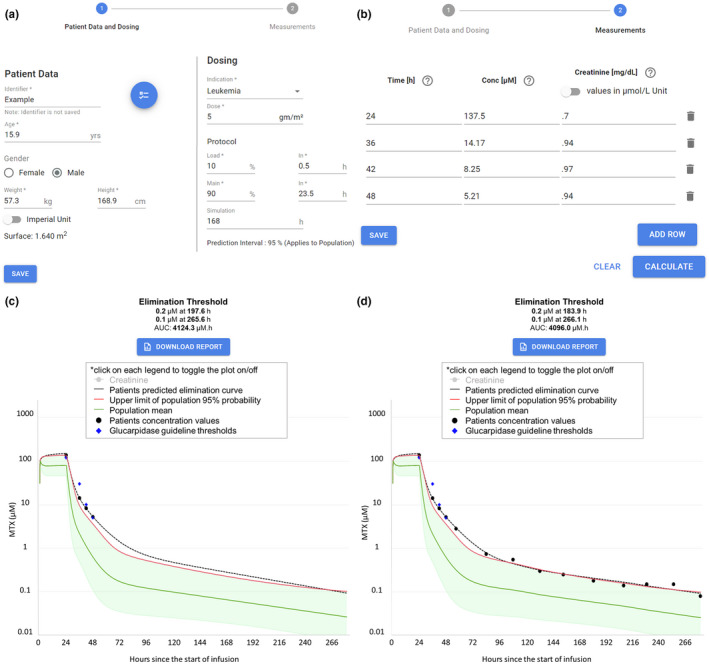
Figure 4.

Screenshots of MTXPK.org. (a) Patient demographics are easily loaded into the “Patient Data and Dosing” screen. Plasma methotrexate (MTX) concentrations and serum creatinine levels are added to the “Measurements” tab (b). After hitting “Calculate,” the individualized pharmacokinetic (PK) estimates and concentration‐time curve are generated (c). With the use of MTXPK.org, the user would conclude that this patient would meet the indication for glucarpidase because the individualized PK elimination curve (black line) is higher than the elimination curve for the population (green line), the two SDs (red line), and is close to the concentrations outline by the glucarpidase guideline (purple diamonds). The full concentration‐time curve for the example patient (d) demonstrates the accurate forecasting of plasma MTX concentrations. AUC, area under the elimination curve.
