
Fig. 2.
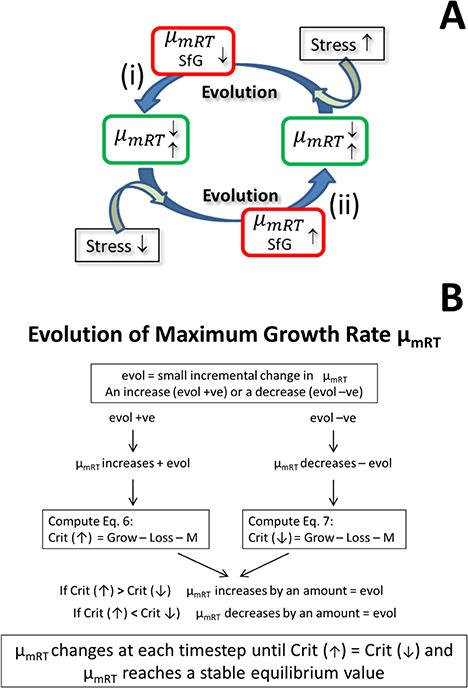
GREM concept. Panel A: the population average maximum growth rate at reference temperature (μmRT) evolves by decreasing (i) or increasing (ii) to attain a new equilibrium value (green boxes) as both maximum growth rate at the reference temperature (μmRT) and the SfG are optimized (red boxes) so minimizing stress. Panel B: the flow-schematic summarizing how evolution affects increases or decreases in μmRT by an amount evol in the GREM model. See text and Supplementary Appendix for further explanation.