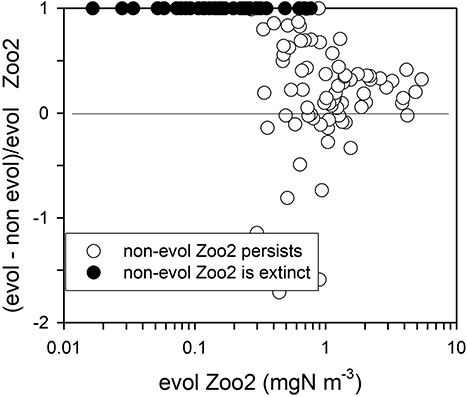
Fig. 8.

Summary of equilibrium values for Zoo2 in NPZZ simulations. Data come from the simulations run to produce Fig. 7, with parameter values distributed evenly over parameter space but run with evolution enabled (the value of evol is determined as in Supplementary Appendix), or with evolution disabled (evol is set to zero). X-axis shows the equilibrium biomass of Zoo2 in the evolving simulations. The Y-axis shows the difference between the Zoo2 biomass in evolving vs non-evolving simulations, normalized to the biomass in the evolving simulations (as given on the X-axis). Y-axis values of 1 thus indicate Zoo2 extinction in the non-evolving simulation; Y-axis = 0 indicates no difference in biomass between Zoo2 evolving and non-evolving; Y-axis < 0 indicates that non-evolving simulations had higher biomass than evolving simulations. Most extinctions occurred in low biomass non-evolving simulations of Zoo2.
