Figure 5.
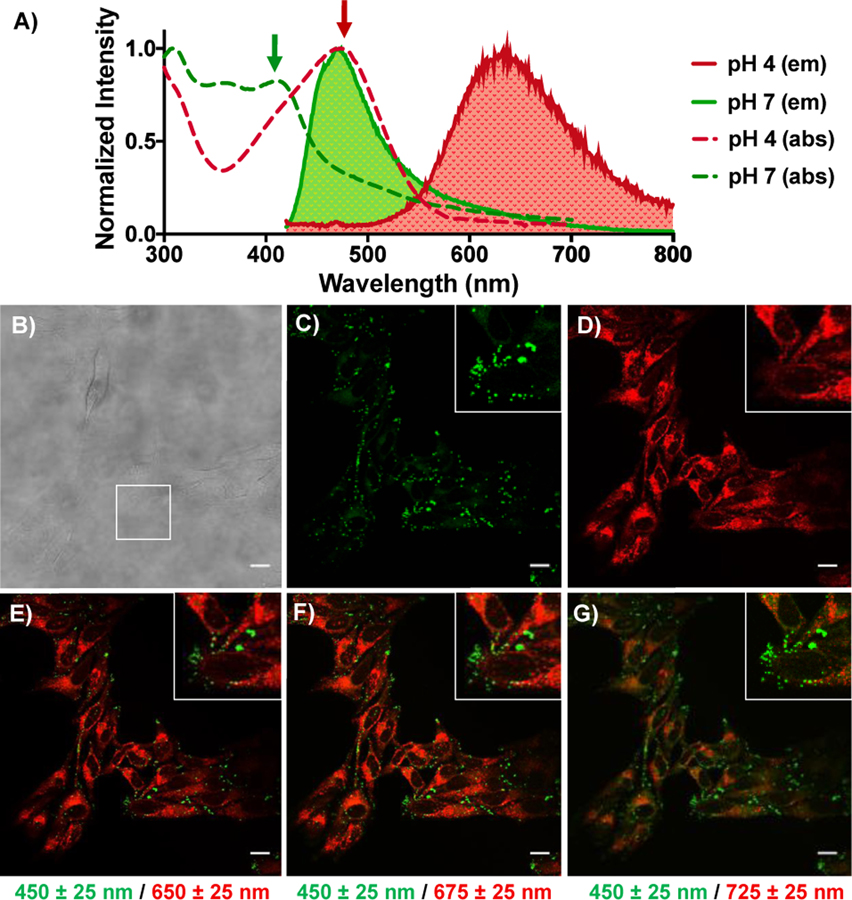
Fluorescence spectrum and live HeLa cell imaging after 3 h incubation of 5a. A) Normalized UV absorption spectra and emission spectra excited by 405 nm are shown in pH 7 and pH 2 buffer. 405 nm and 488 nm lasers for microscopy excitation are shown by arrows. B) Differential interference contrast (DIC) image of Hela cells after 3 h incubation of 5a C) λex = 405 nm, λem = 425–475 nm D) λex = 488 nm, λem = 650–700 nm E-G) Merged images of green (λex = 405 nm, λem = 425–475 nm) and red (λex = 488 nm, λem = 625–675 nm) in E), red (λex = 488 nm, λem = 650–700 nm) in F), and red (λex = 488 nm, λem = 700–750 nm) in G).

