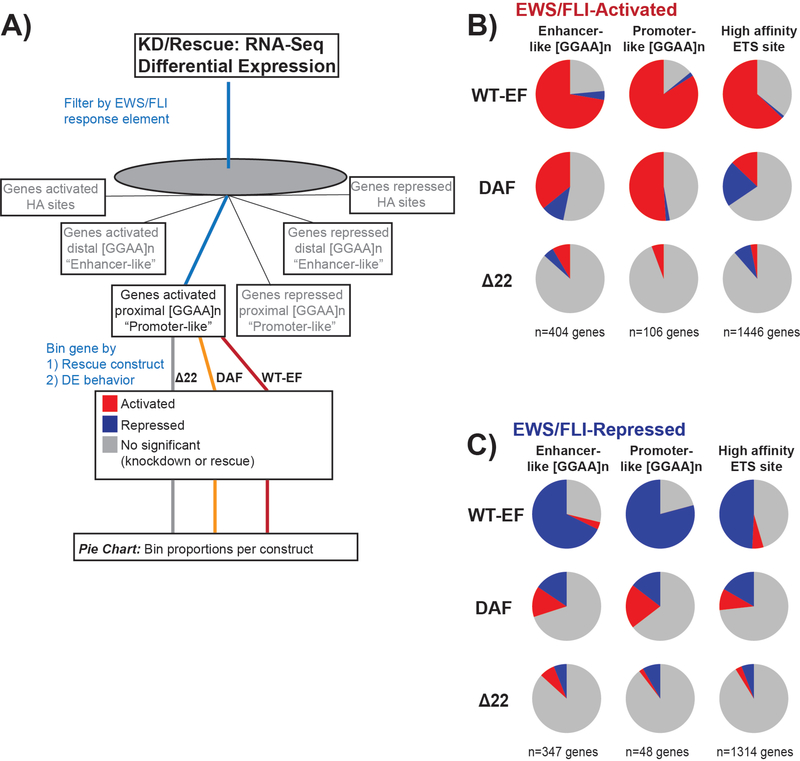
Figure 7: Detailed analysis of different transcription factor response elements to different constructs:
(A) Schematic depicting the data processing used to generate panels (B) and (C) by incorporating other available datasets with the transcriptomic profiles here. (B,C) Compilation showing the rescue of different classes of direct EWS/FLI- (B) activated and (C) repressed targets. Genes included were only those genes with detectable differential expression by endogenous EWS/FLI. In each pie chart, gray depicts the portion of genes which are not rescued by the construct. Red depicts the portion of genes that are differentially activated, and blue depicts the portion of genes that are differentially repressed. This figure is adapted from Theisen, et al.23

