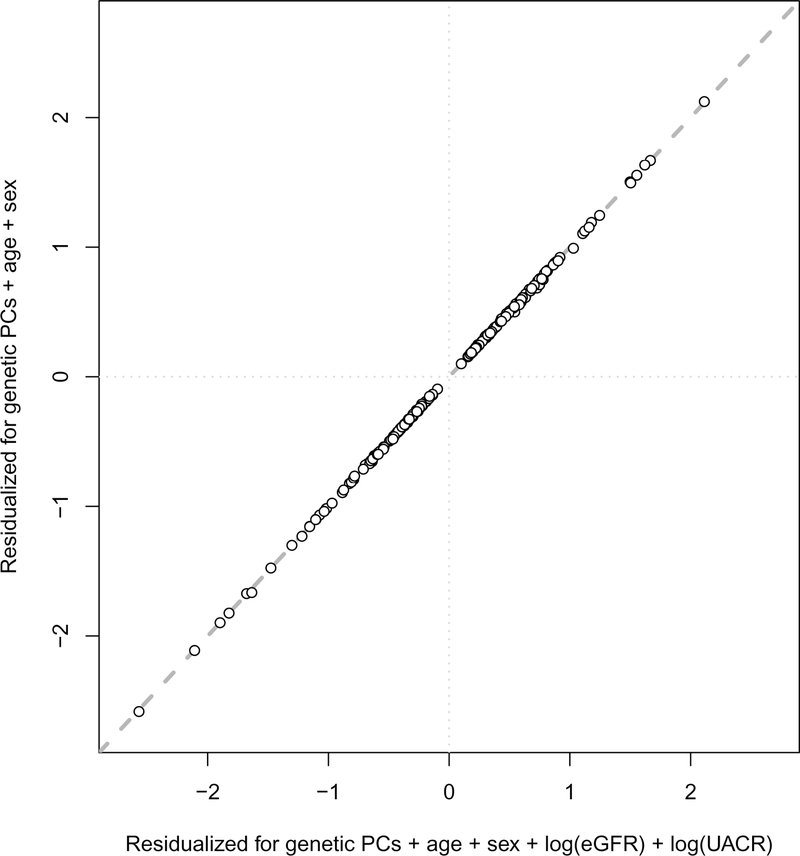
Extended Data Fig. 2. Comparison of genetic effects with and without adjustment for eGFR.
Each point represents one of the 240 replicated metabolite-associated mQTLs. Genetic effect size estimates per modeled risk allele including adjustment for eGFR and UACR (x axis) by linear regression, as done in the main analysis, were plotted against those obtained after adjustment for genetic PCs, age and sex only (y axis).

