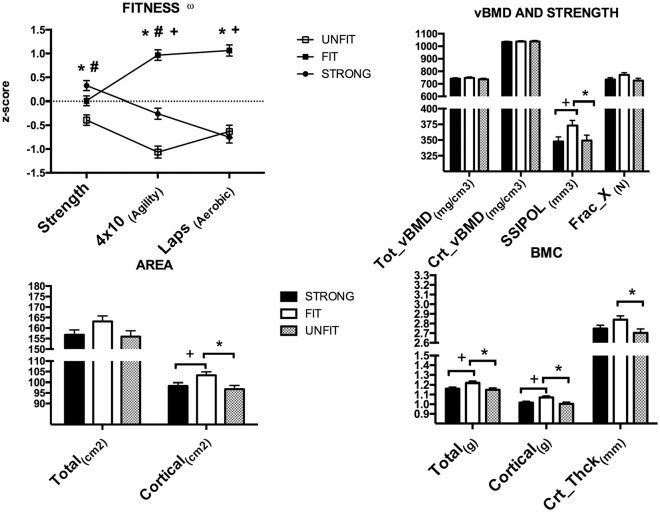
Figure 1.
Physical fitness z-scores and adjusted by tibial length and age bone content, structure, and strength according to cluster group. BMC, bone mineral content; Crt_Thck, cortical thickness; Frac_X, bone strength with regard to the x-axis; SSIPOL, polar strength strain index; vBMD, volumetric bone mineral density. ωAgility z-scores were inverted, with lower z-scores representing low agility values. *Significant difference between fit and unfit groups. #Significant difference between strong and unfit groups. +Significant difference between fit and strong groups.

